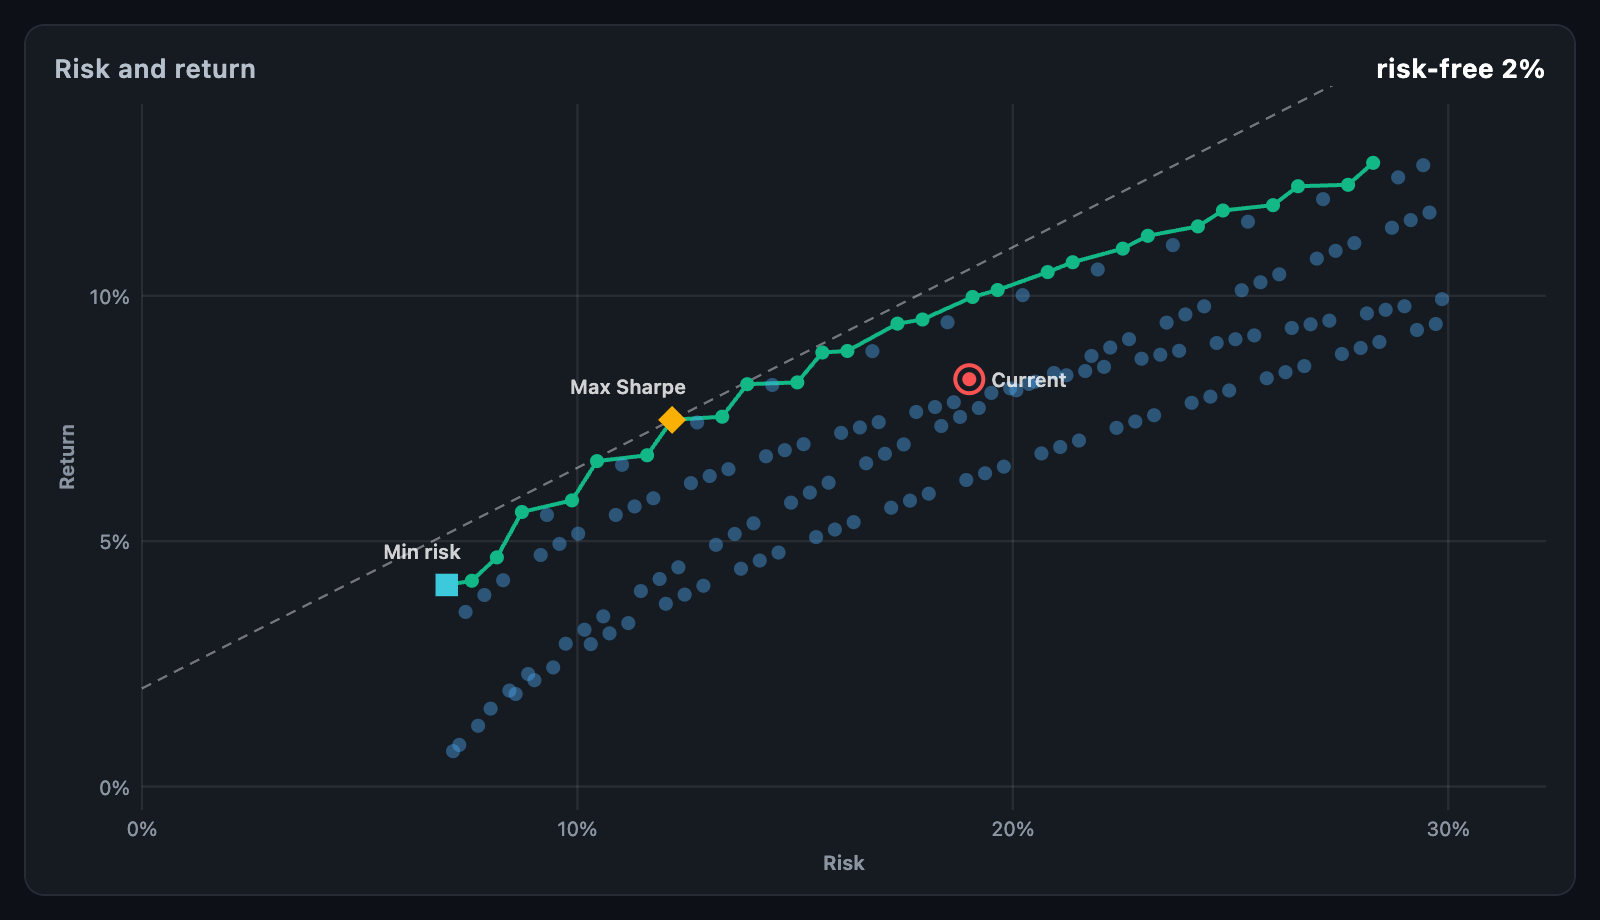
EfficientFrontierChart plots portfolios by risk and expected return and traces
the efficient frontier through the ones nothing beats: for the risk they
carry, no other candidate returns more. It marks the portfolio with the best
return per unit of risk, the least risky one, and — optionally — the portfolio
you hold now, apart from the candidates.
EfficientFrontierChart(
  points: [
    for (final w in candidateWeights)
      PortfolioPoint(risk: w.volatility, expectedReturn: w.mean),
  ],
  riskFreeRate: 0.02,
  current: const PortfolioPoint(risk: 0.14, expectedReturn: 0.07),
  riskFormatter: (v) => '${(v * 100).toStringAsFixed(0)}%',
  returnFormatter: (v) => '${(v * 100).toStringAsFixed(0)}%',
);
The chart fills its constraints. When the height is unbounded, it uses
defaultHeight.
| Field | Description |
|---|---|
risk |
Volatility, or standard deviation |
expectedReturn |
What it is expected to return, in the same period and unit |
label, color, data |
Name, a colour of its own, and app data returned on touch |
risk and expectedReturn share a unit — fractions or percentages — and a
period, such as annualised.
| Mark | Meaning | Switch |
|---|---|---|
| Line through green dots | The frontier: portfolios no other beats | showFrontier |
| Diamond | The best return per unit of risk above riskFreeRate |
showMaxSharpe |
| Square | The least risky portfolio | showMinRisk |
| Dashed line | The capital market line, from the risk-free rate through the diamond | showCapitalMarketLine |
| Ringed dot | current, the portfolio held now |
pass current |
| Function | Description |
|---|---|
efficientFrontierIndices(points) |
The frontier's indices, by rising risk |
maxSharpeIndex(points, riskFree:) |
The best return per unit of risk, or null |
minRiskIndex(points) |
The least risky portfolio |
PortfolioPoint.sharpe(riskFree) |
One portfolio's return per unit of risk above the rate |
frontierRange(points) |
The axis ranges the chart would pick |
A portfolio with a number that is not finite is never on the frontier and is not drawn.
| Parameter | Description |
|---|---|
portfolioColor, frontierColor, maxSharpeColor, minRiskColor, currentColor |
Colours |
dotRadius, markerSize, frontierWidth |
Sizes |
showMarkerLabels, maxSharpeLabel, minRiskLabel, currentLabel |
Names beside the markers |
showAxes, riskFormatter, returnFormatter, riskAxisTitle, returnAxisTitle |
Axes |
gridColor, hoverBorder, backgroundColor, padding |
Grid, hover ring, box |
onTouch reports a FrontierTouchDetails with the dot (its role, point and
index) and the sharpe ratio, and null when the pointer leaves.
tooltipBuilder builds a card beside the dot.
animationDuration grows the plot in; animationCurve eases it and
animateOnMount controls the first build. It animates again only when the
portfolios' values change.