Each image links to the documentation page for that feature.
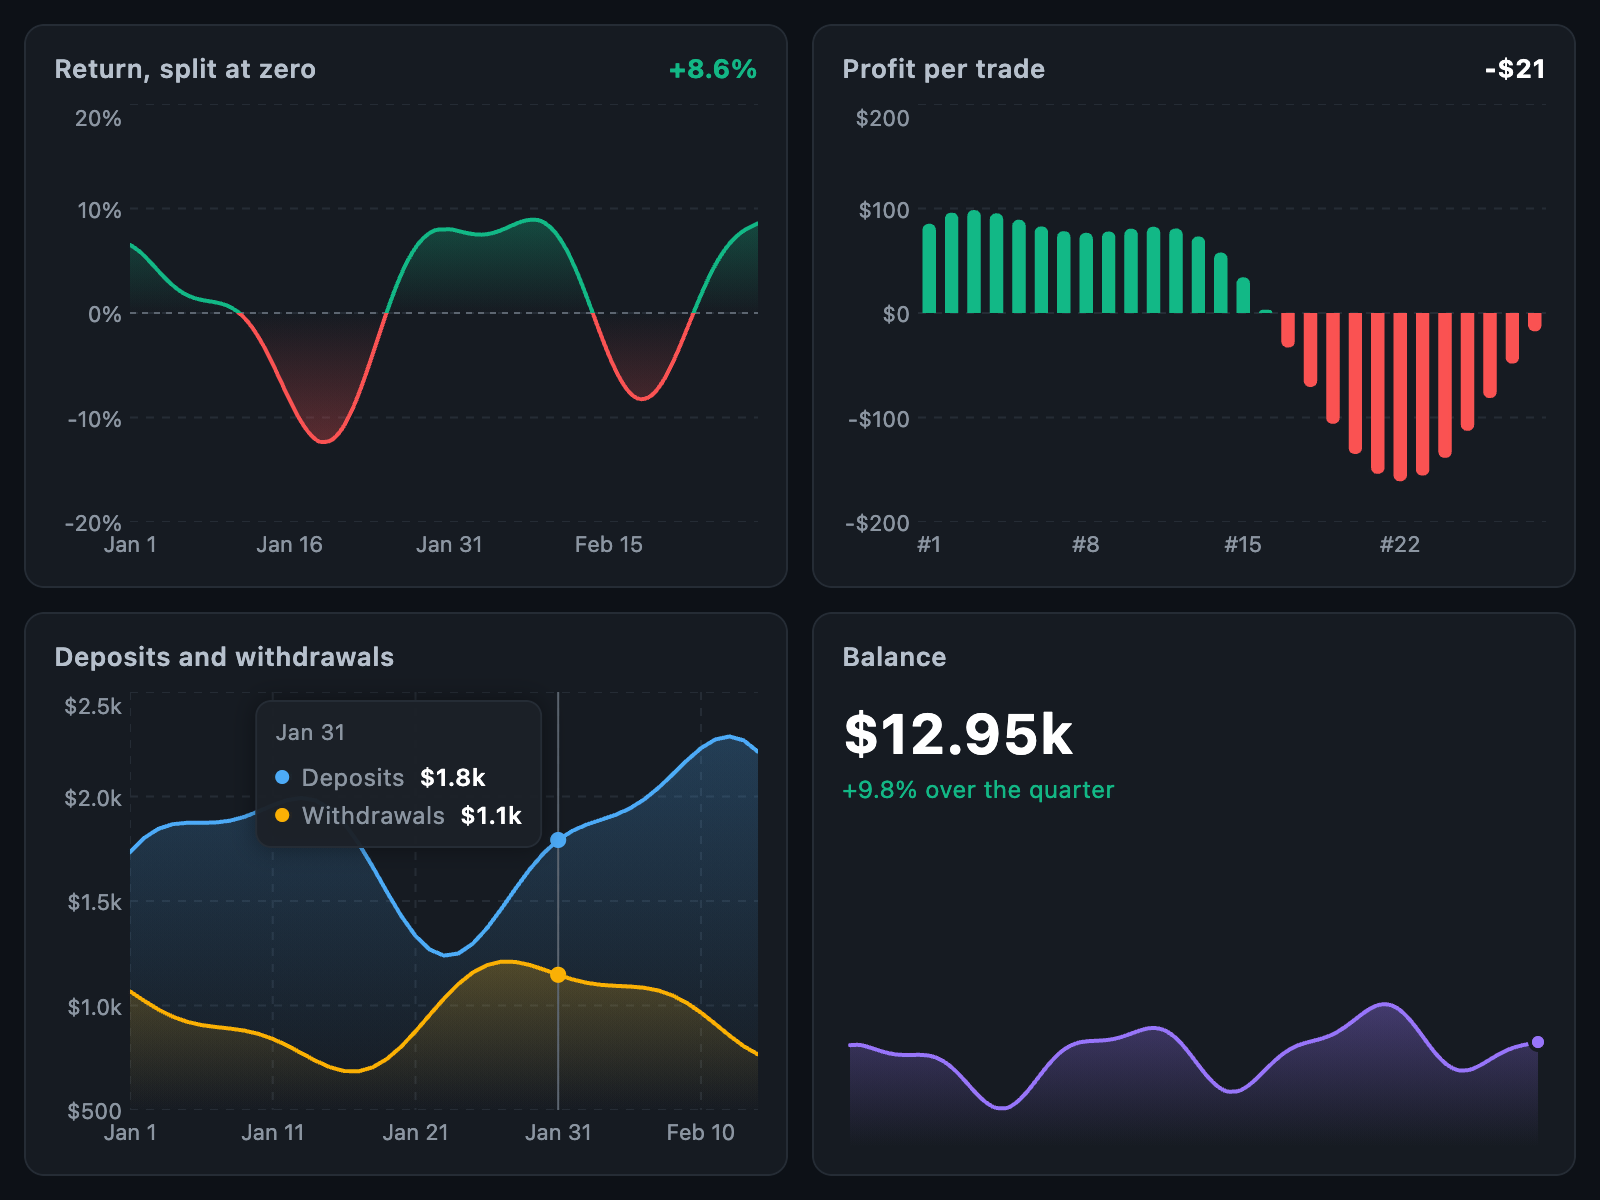 Four business charts Returns split at zero, profit bars, cash flows with a tooltip, and a sparkline. |
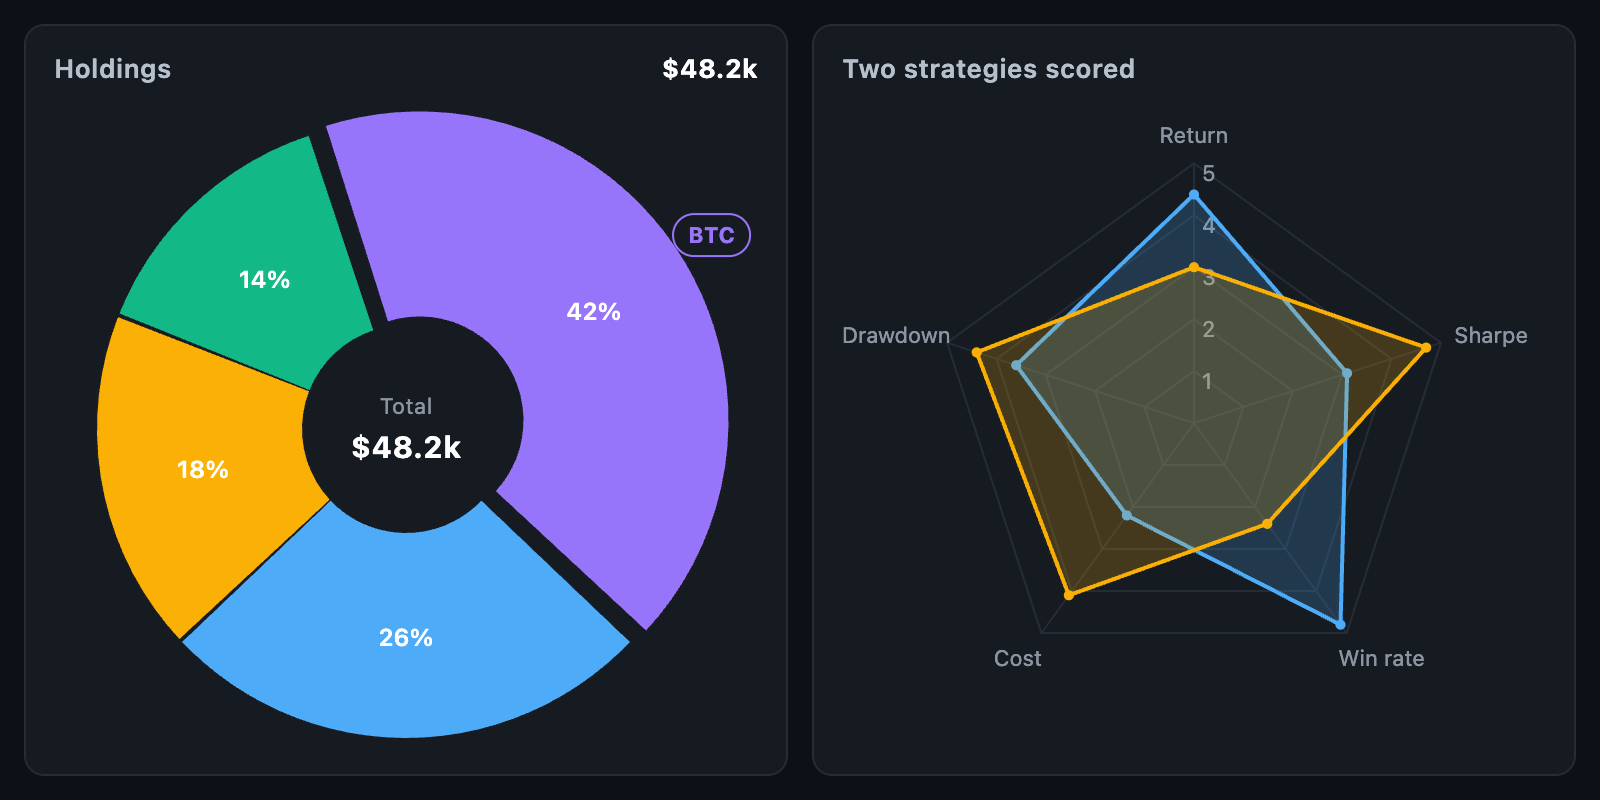 Pie and radar A doughnut with its total in the centre, and a radar comparing two strategies. |
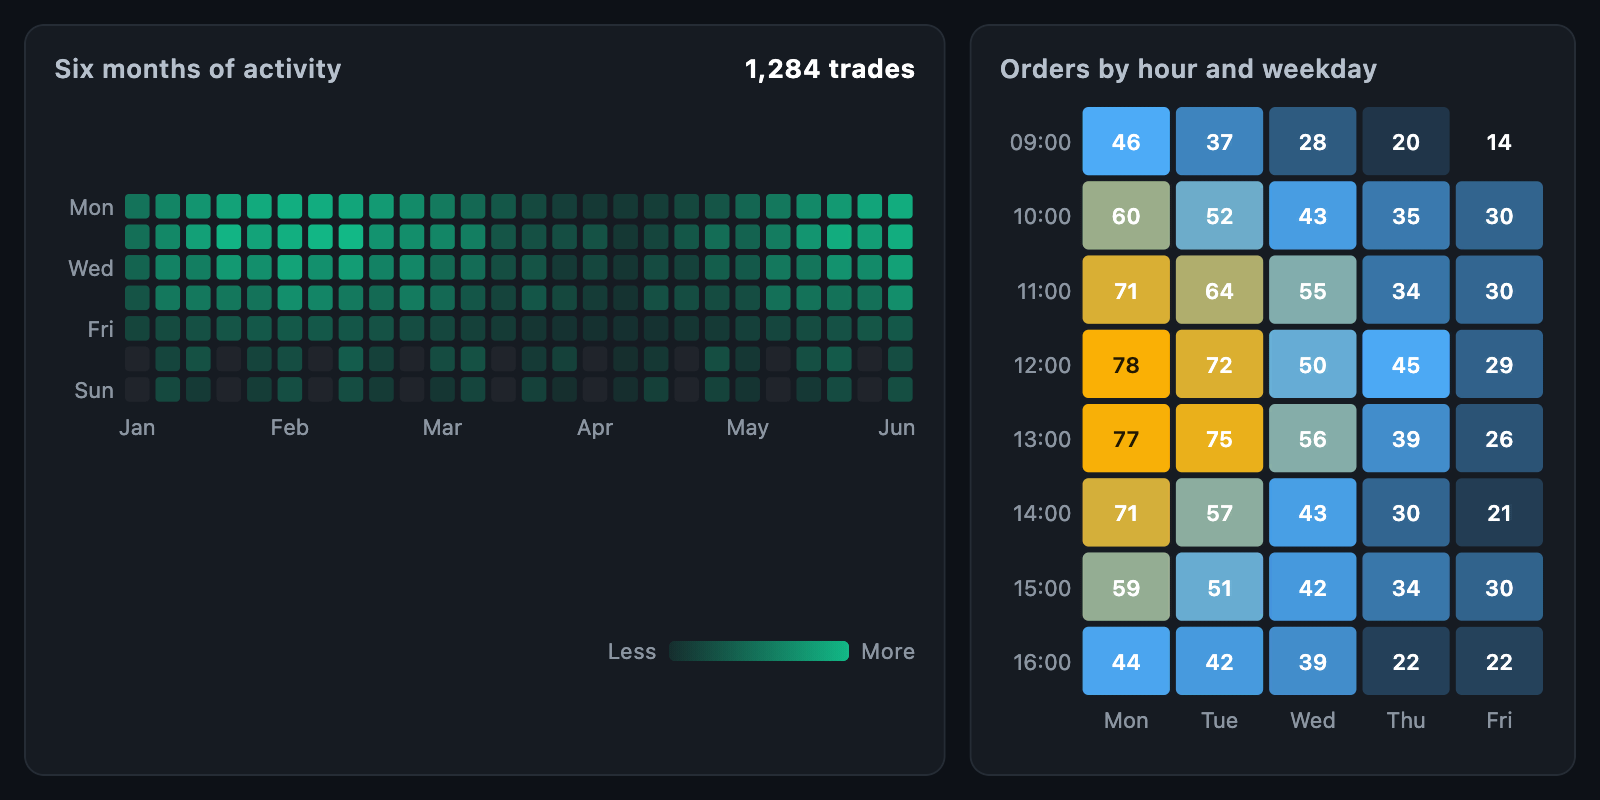 Heatmap Six months of activity, and orders by hour and weekday. |
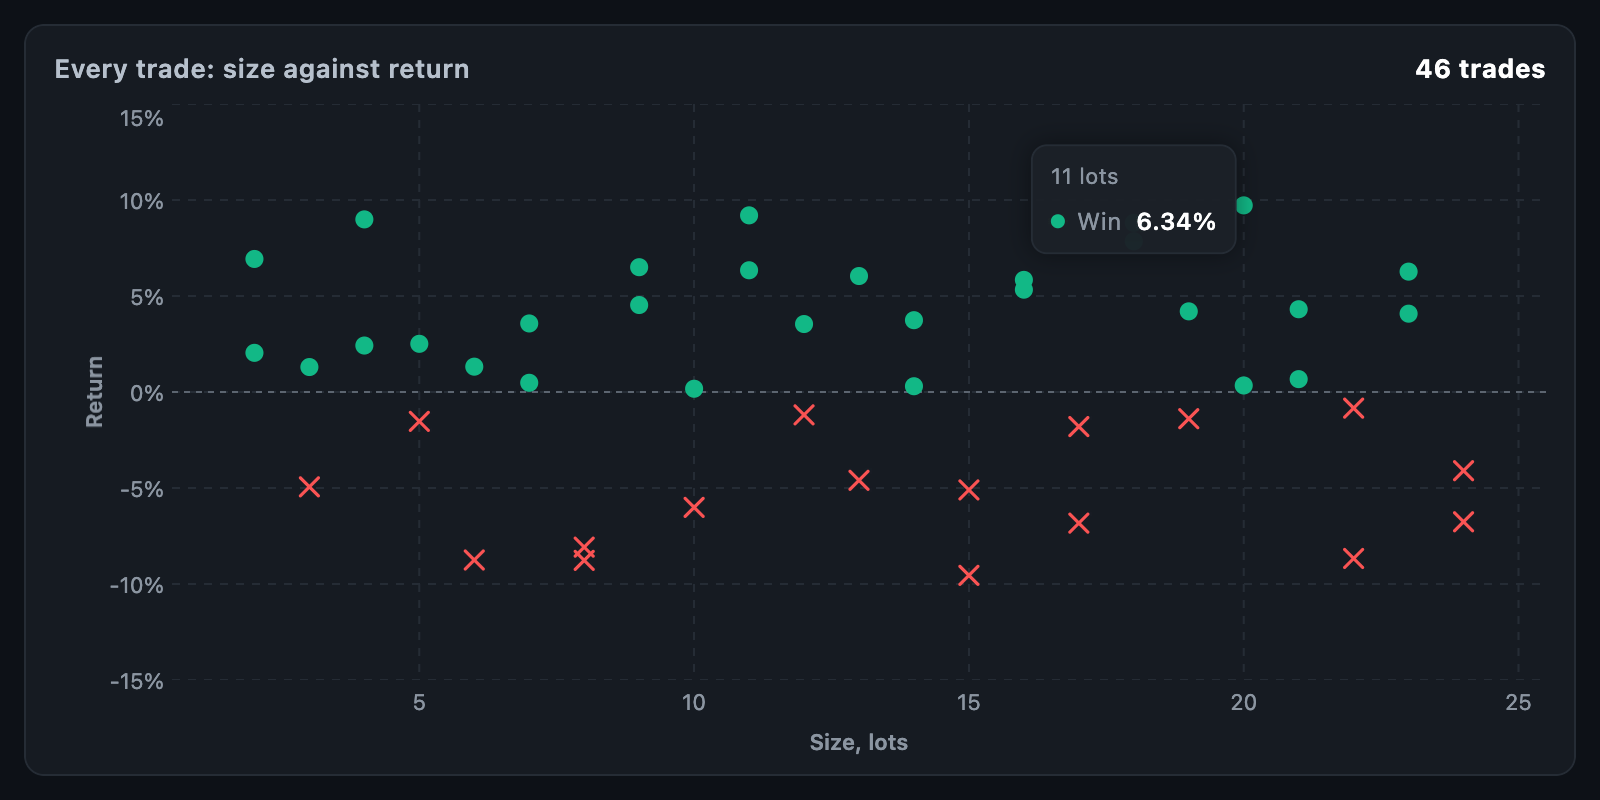 Scatter One point per trade, with per-point shape and colour and a single-point readout. |
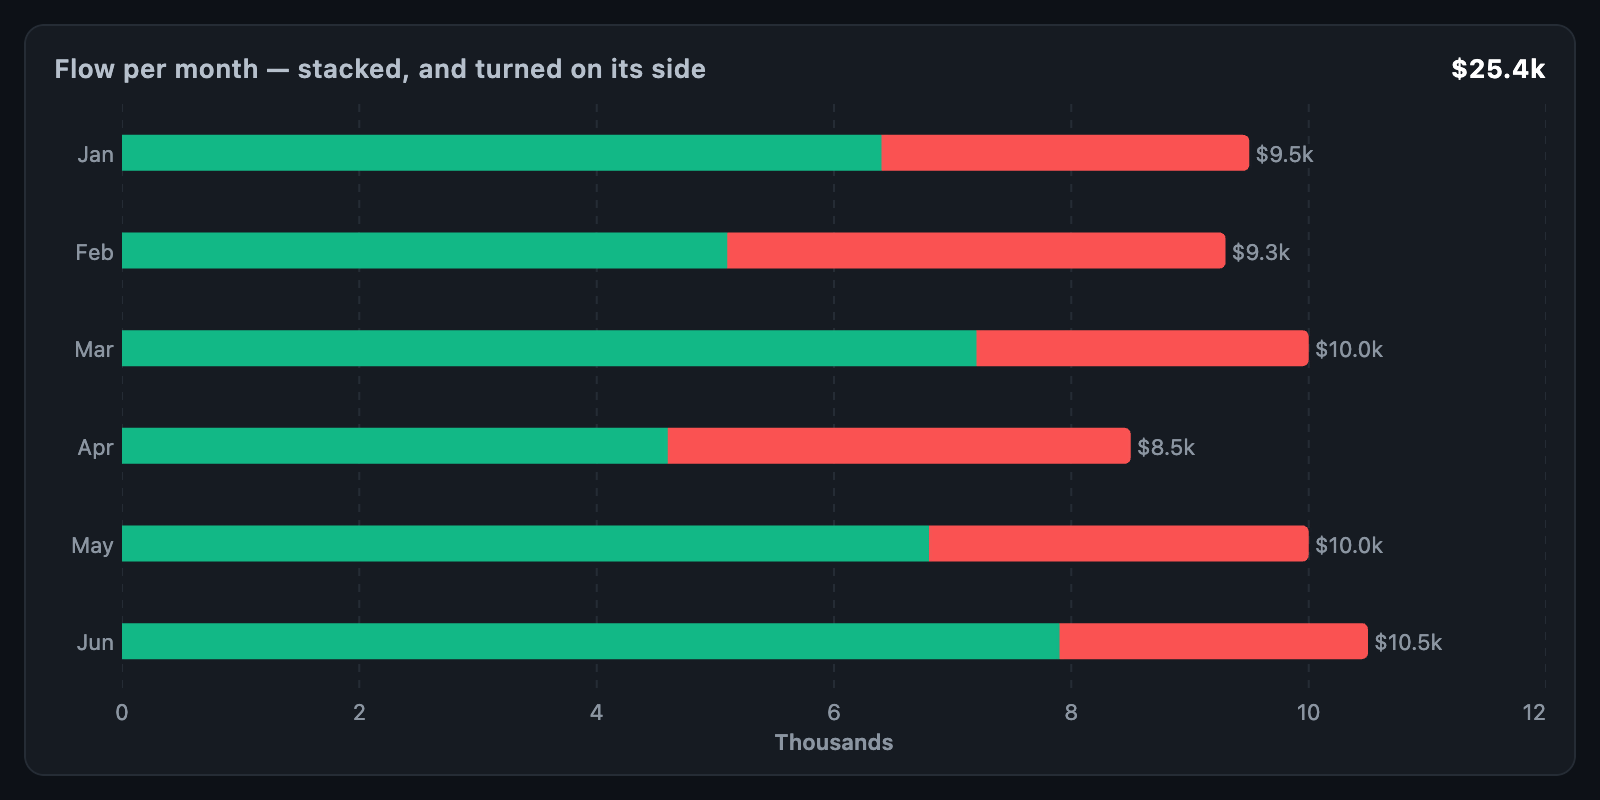 Stacked horizontal bars Stacked bars in horizontal orientation, with titled axes. |
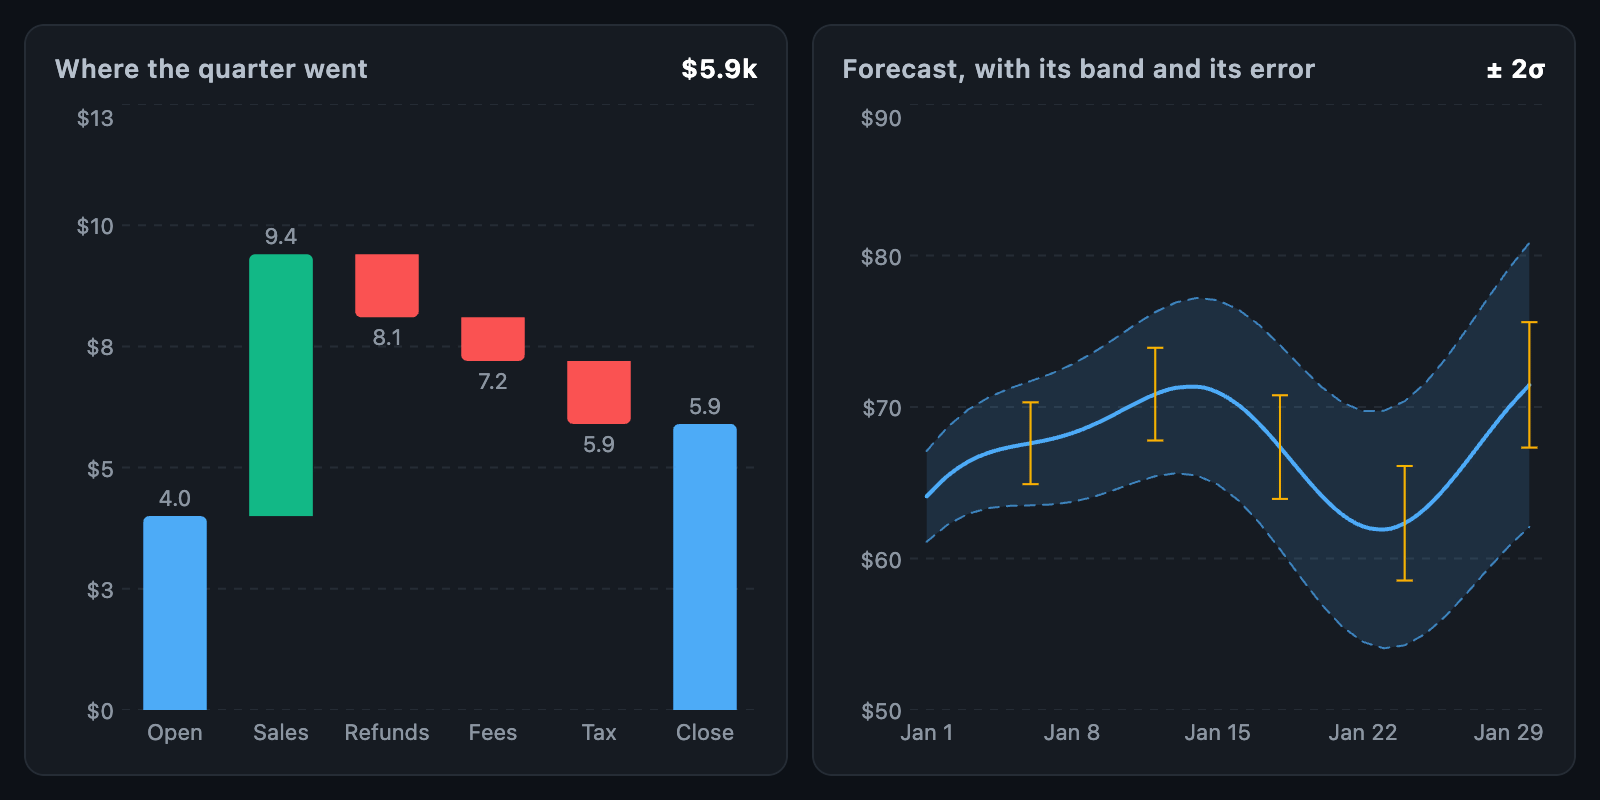 Floating bars and bands A waterfall chart, and a forecast band with error bars. |
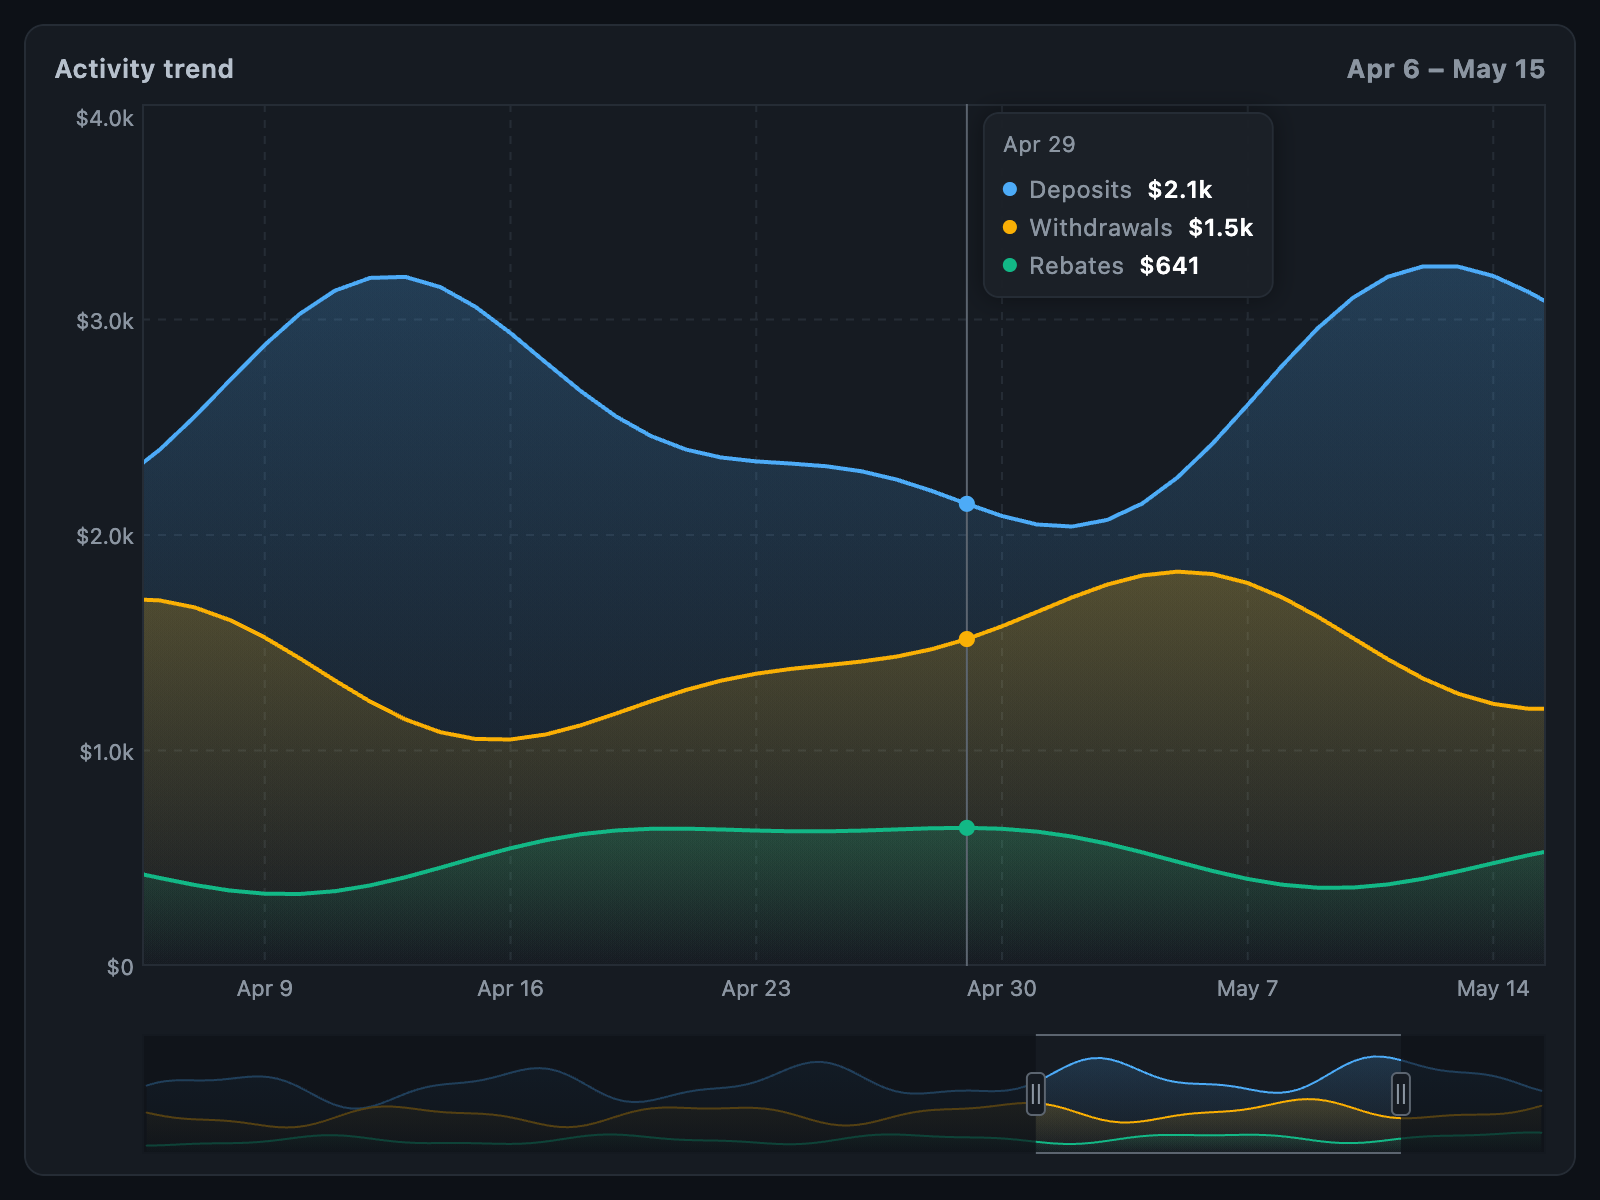 Range selector Three series over five months, with a range selector below. |
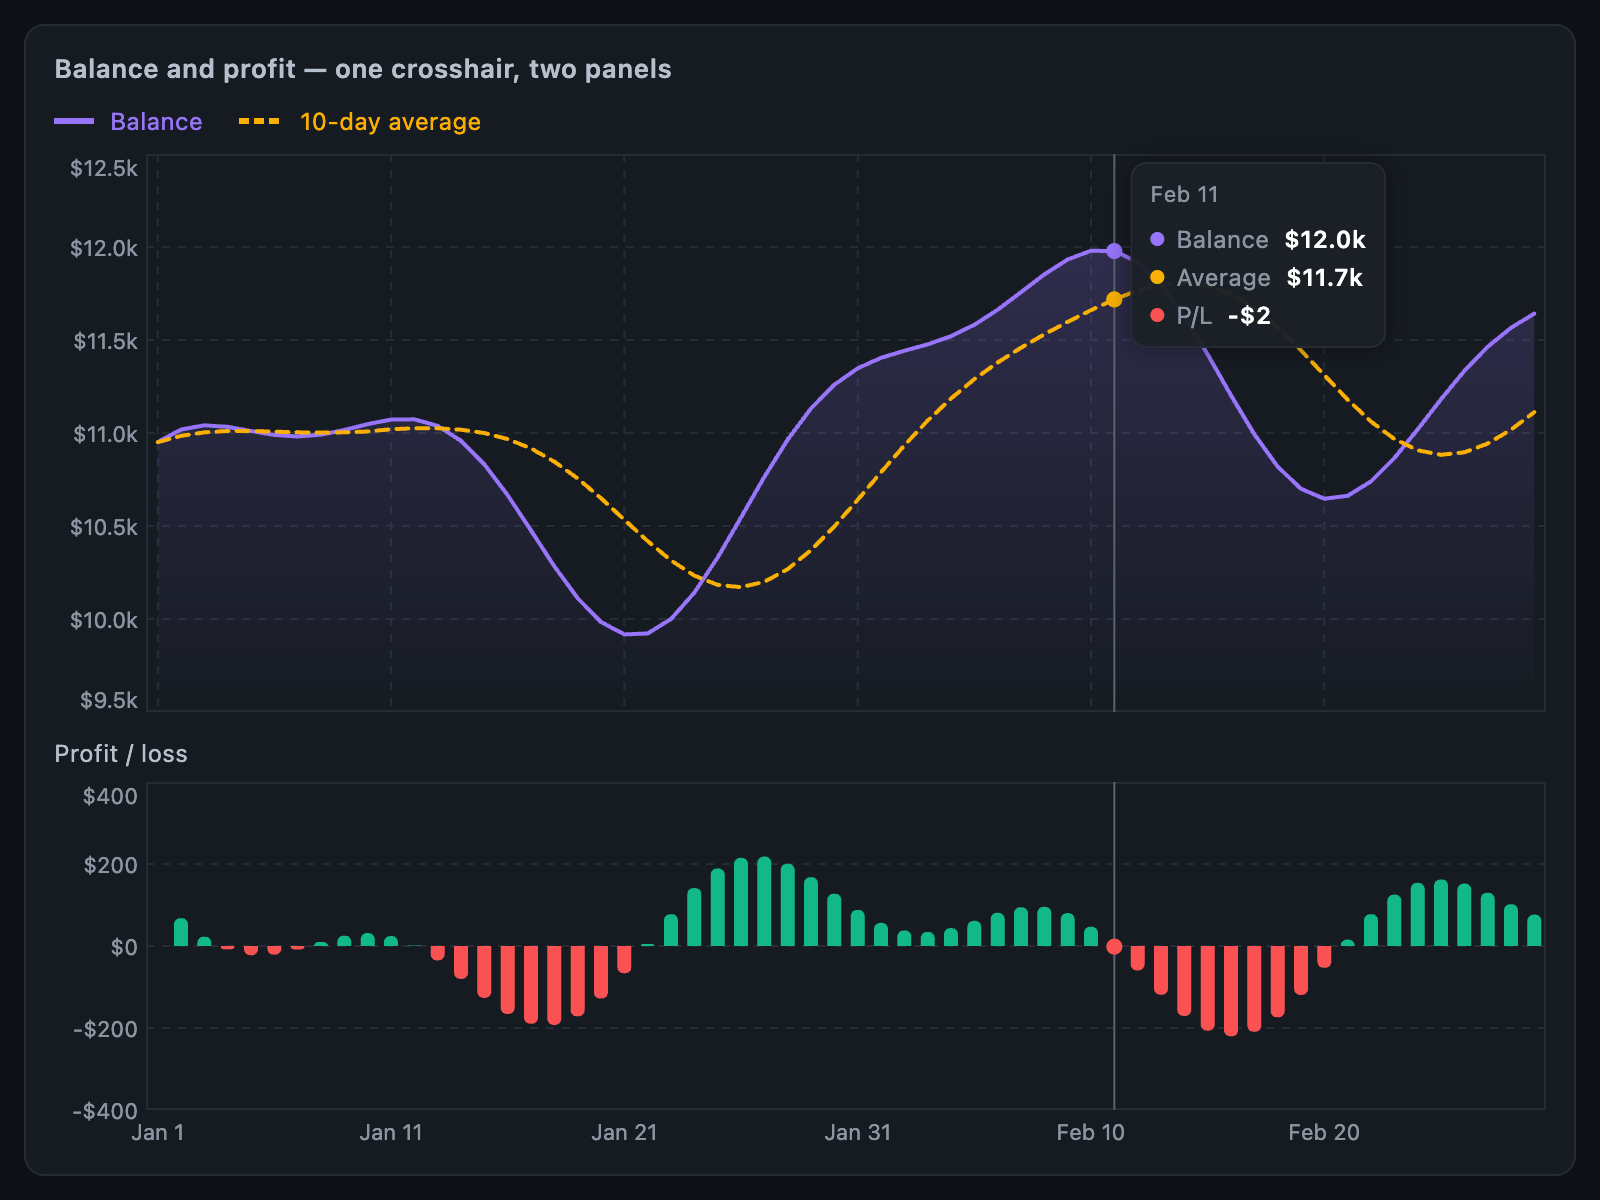 Synchronised crosshair Balance and profit panels sharing one crosshair. |
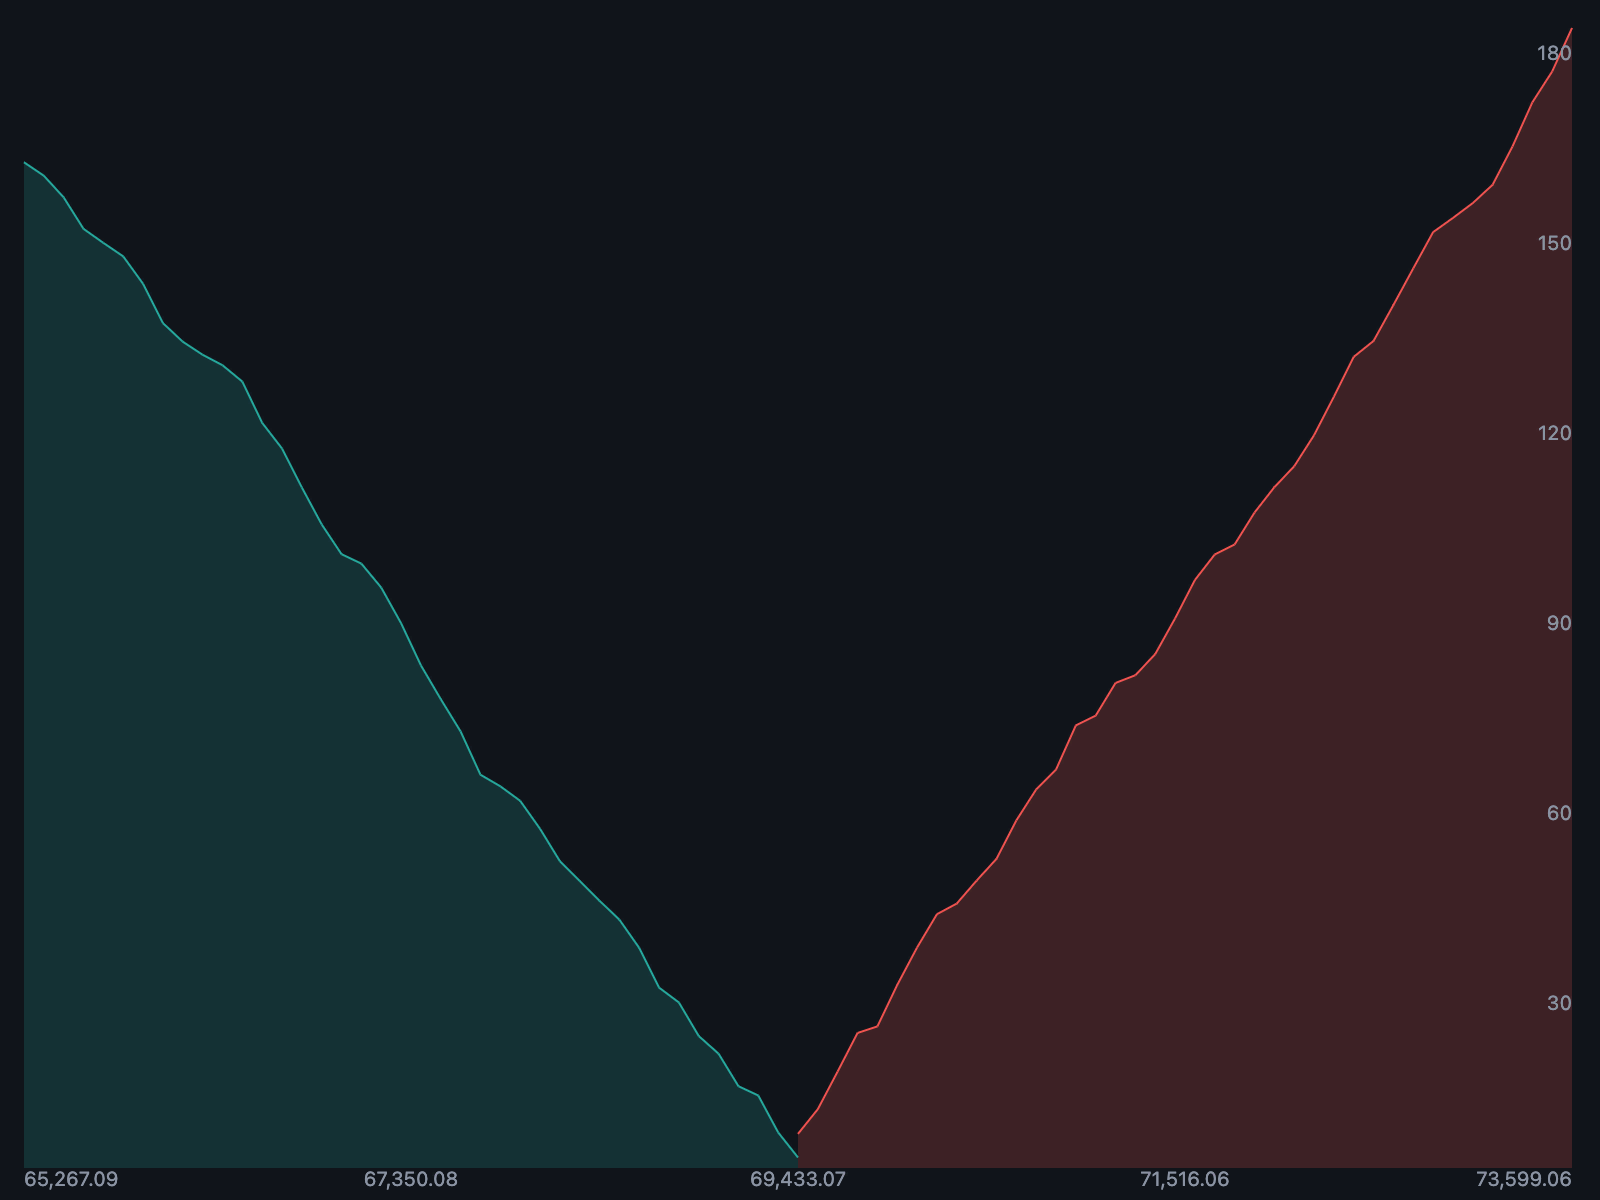 Depth chart Cumulative bid and ask depth. |
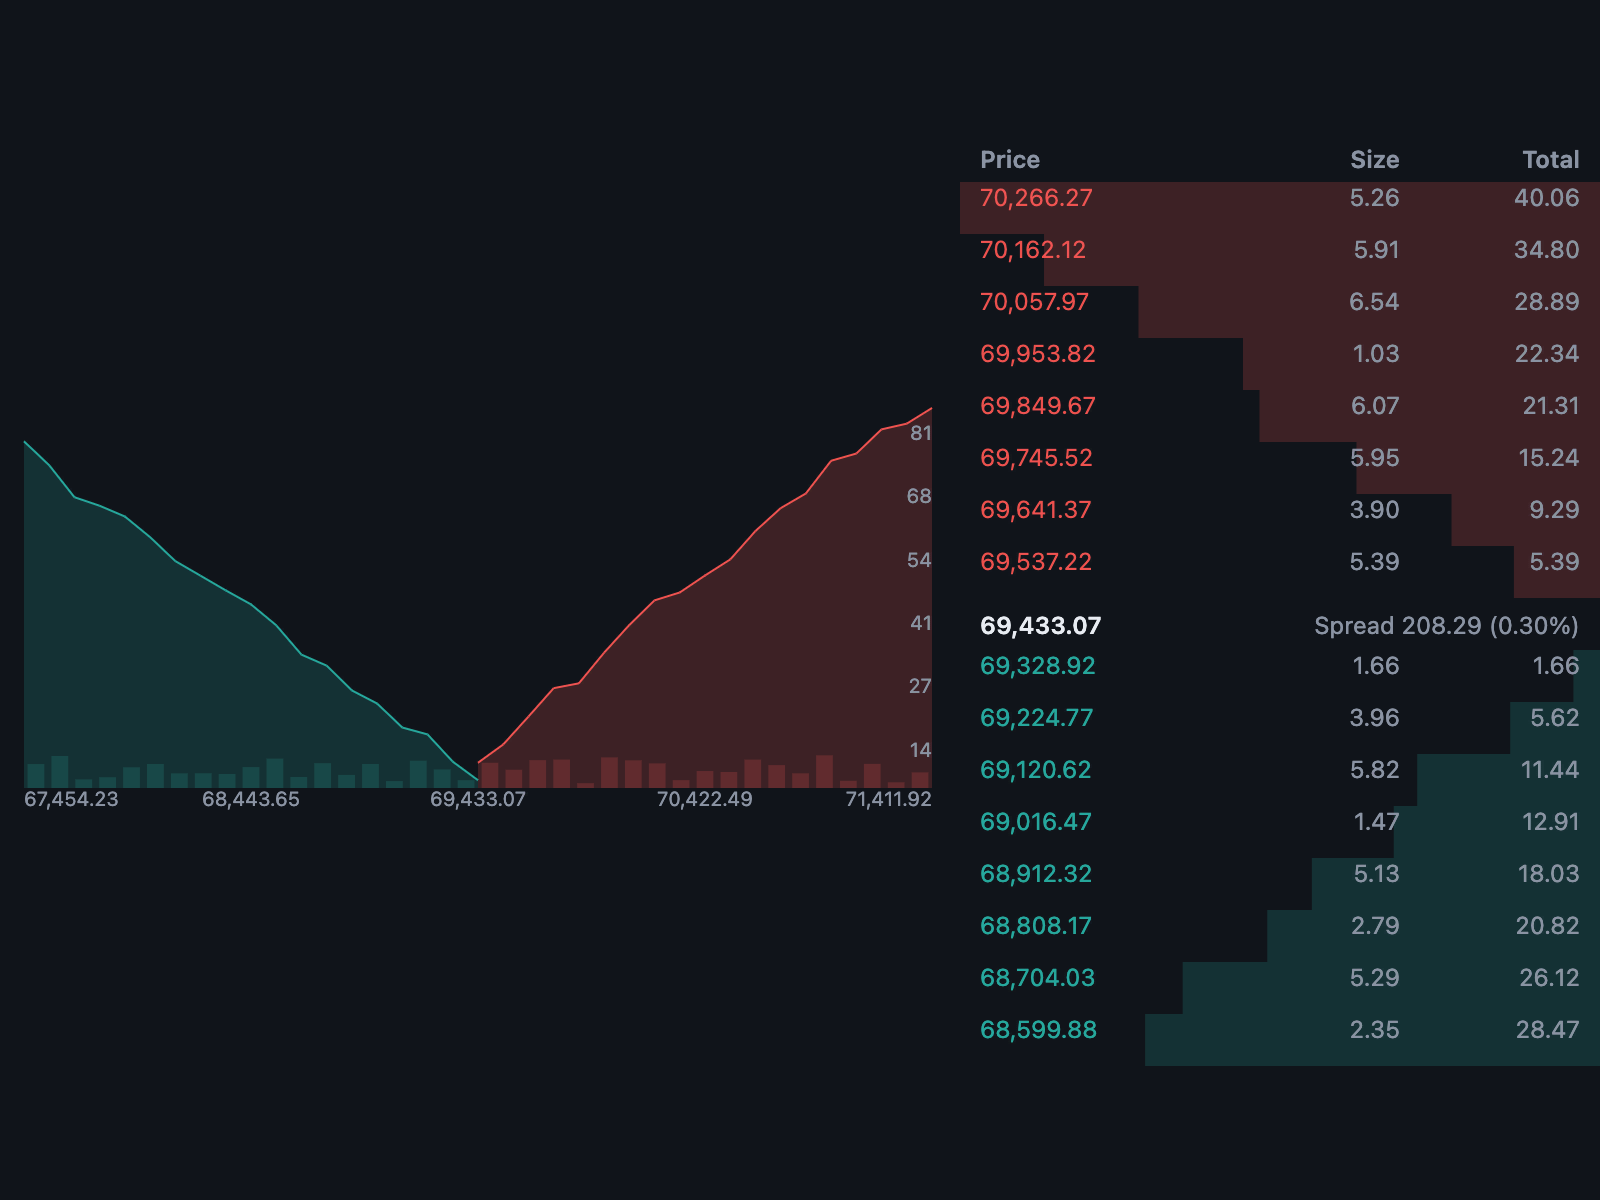 Depth chart modes Cumulative, histogram, combined and ladder modes. |
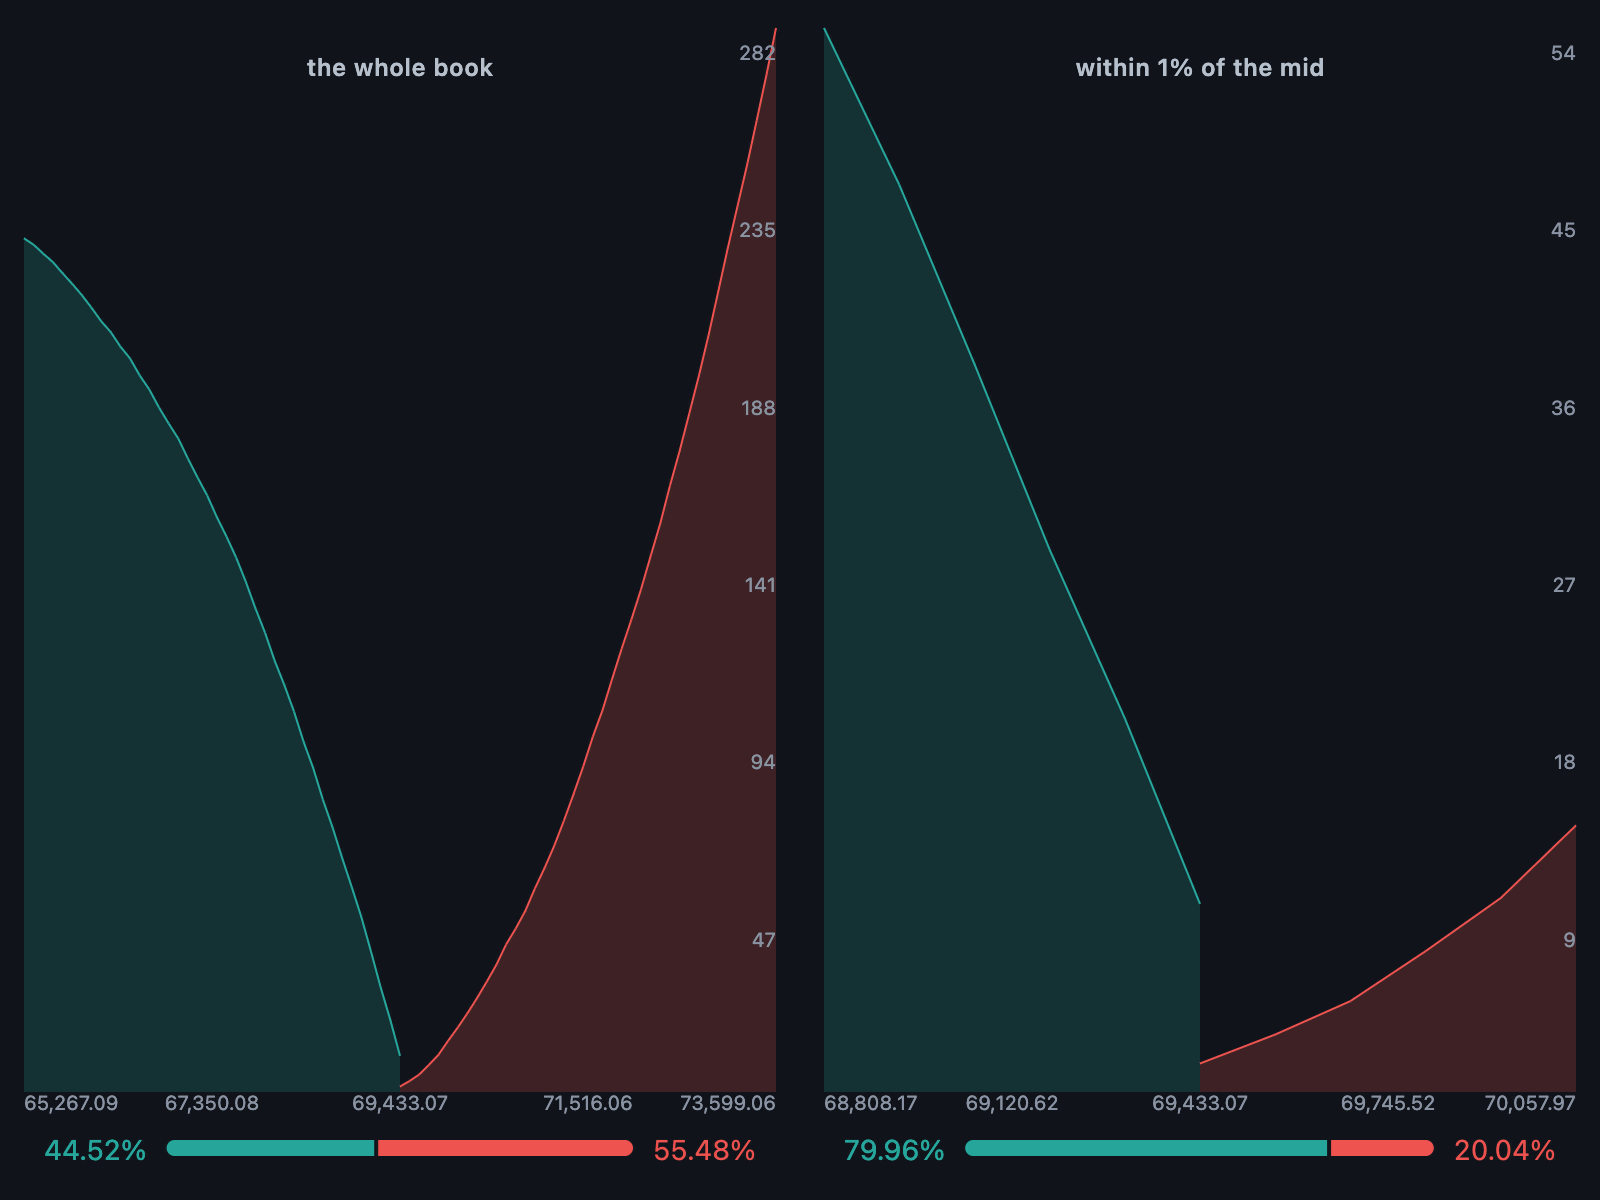 The bid/ask ratio bar The balance of bid and ask volume, below the depth chart. |
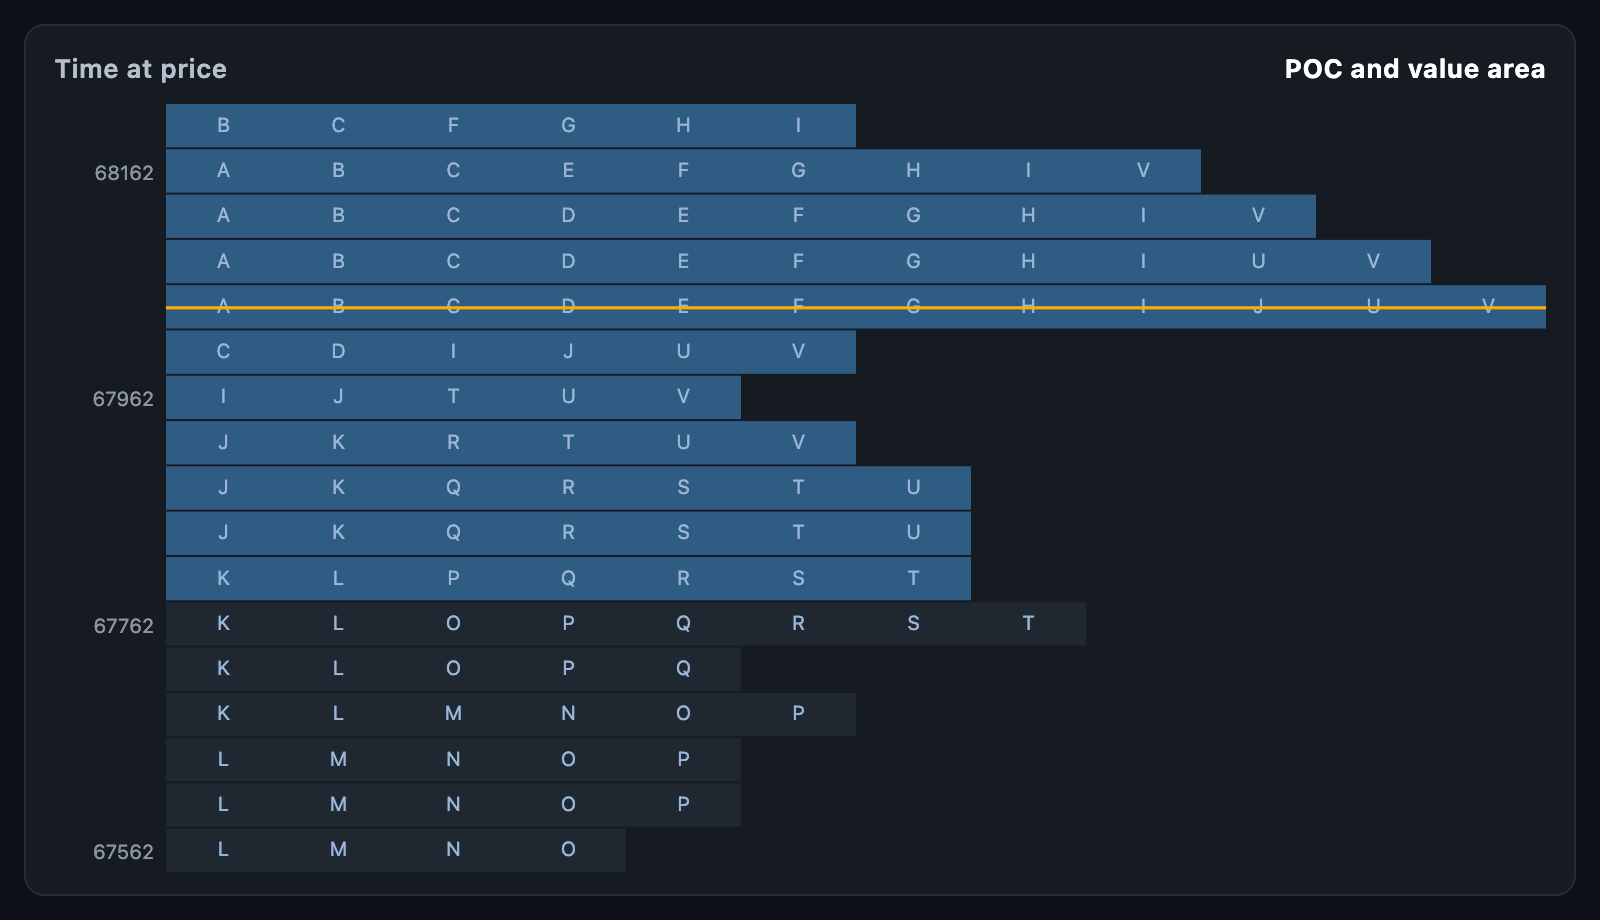 Market profile Time at price as TPO letters, with the point of control and value area. |
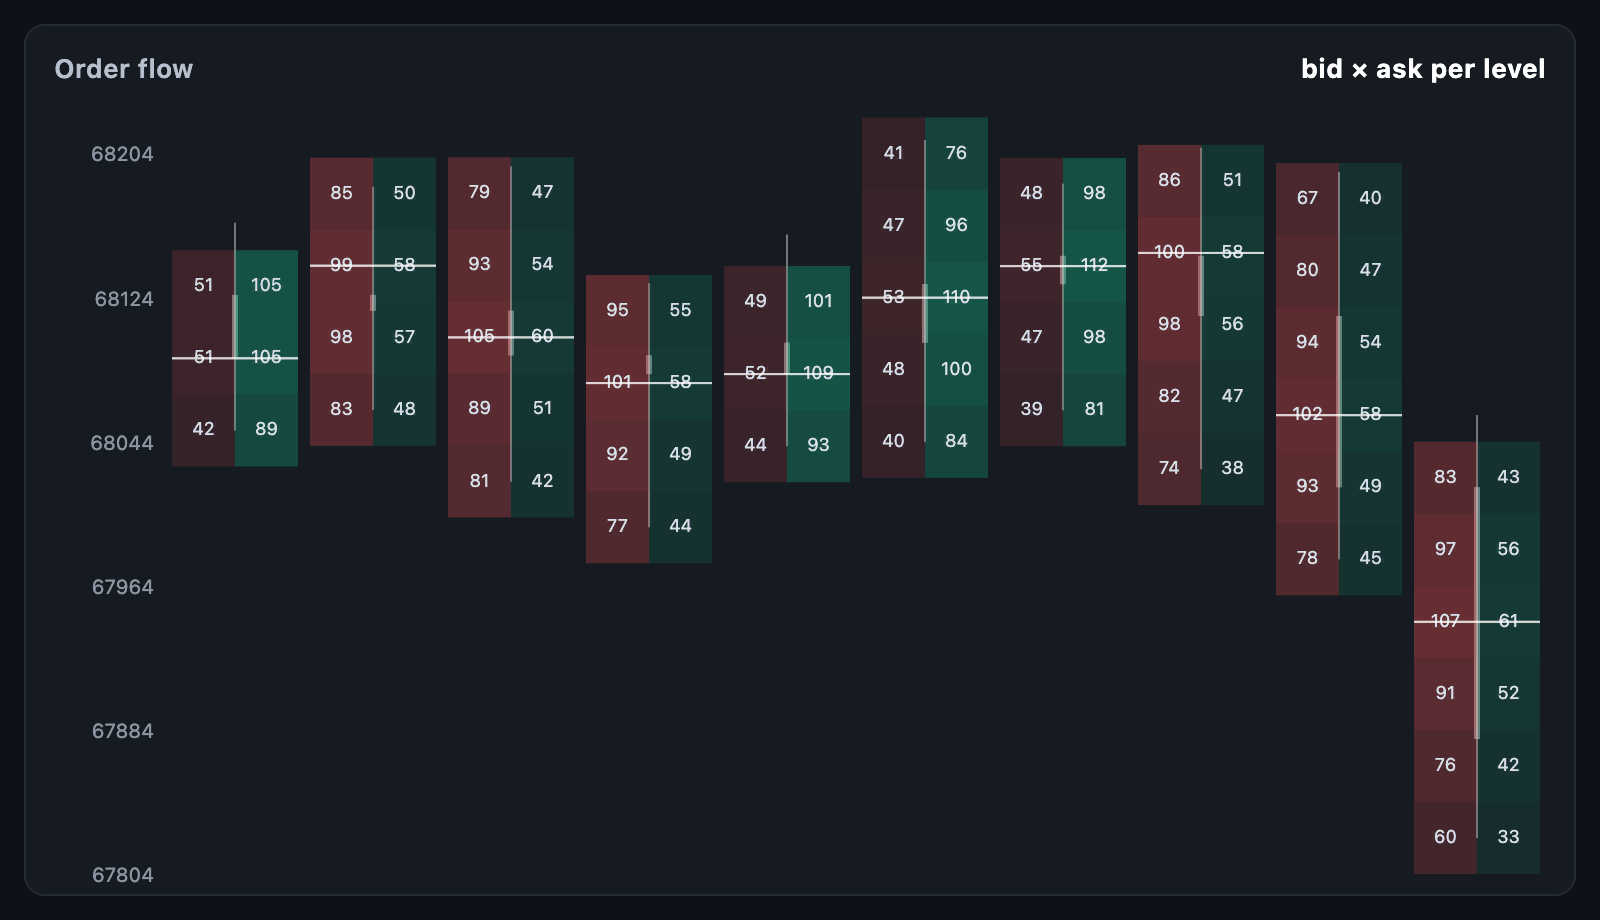 Footprint Bid and ask volume at every price, inside each candle. |
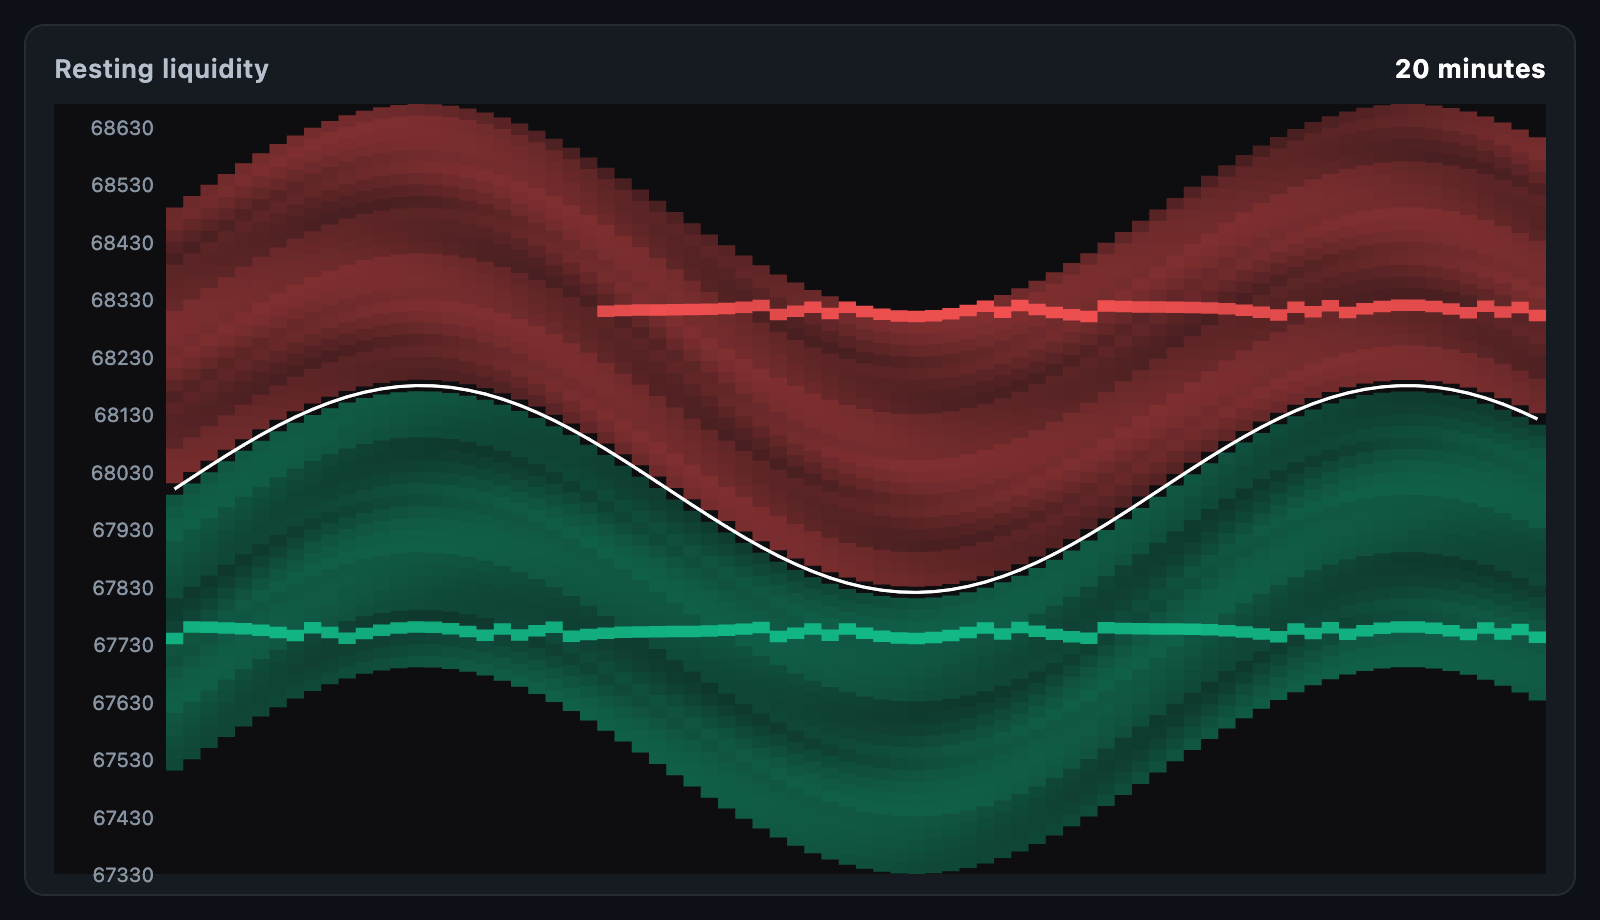 Order-book heatmap Resting liquidity over time, with walls as bright lines. |
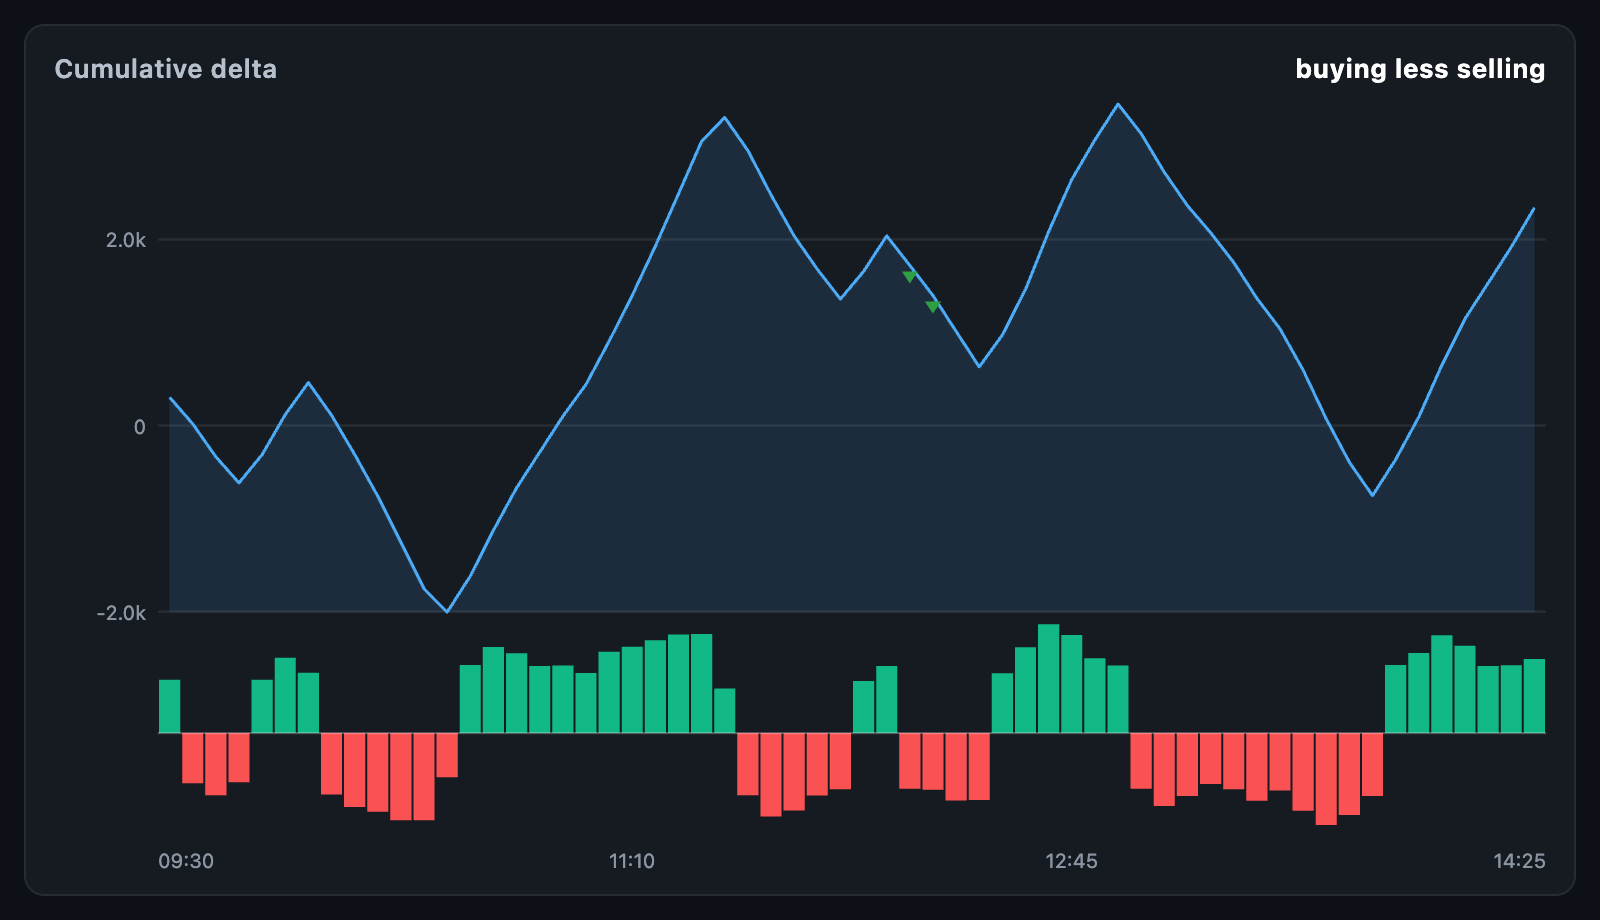 Cumulative delta Running delta over a session, with buying and selling per bar. |
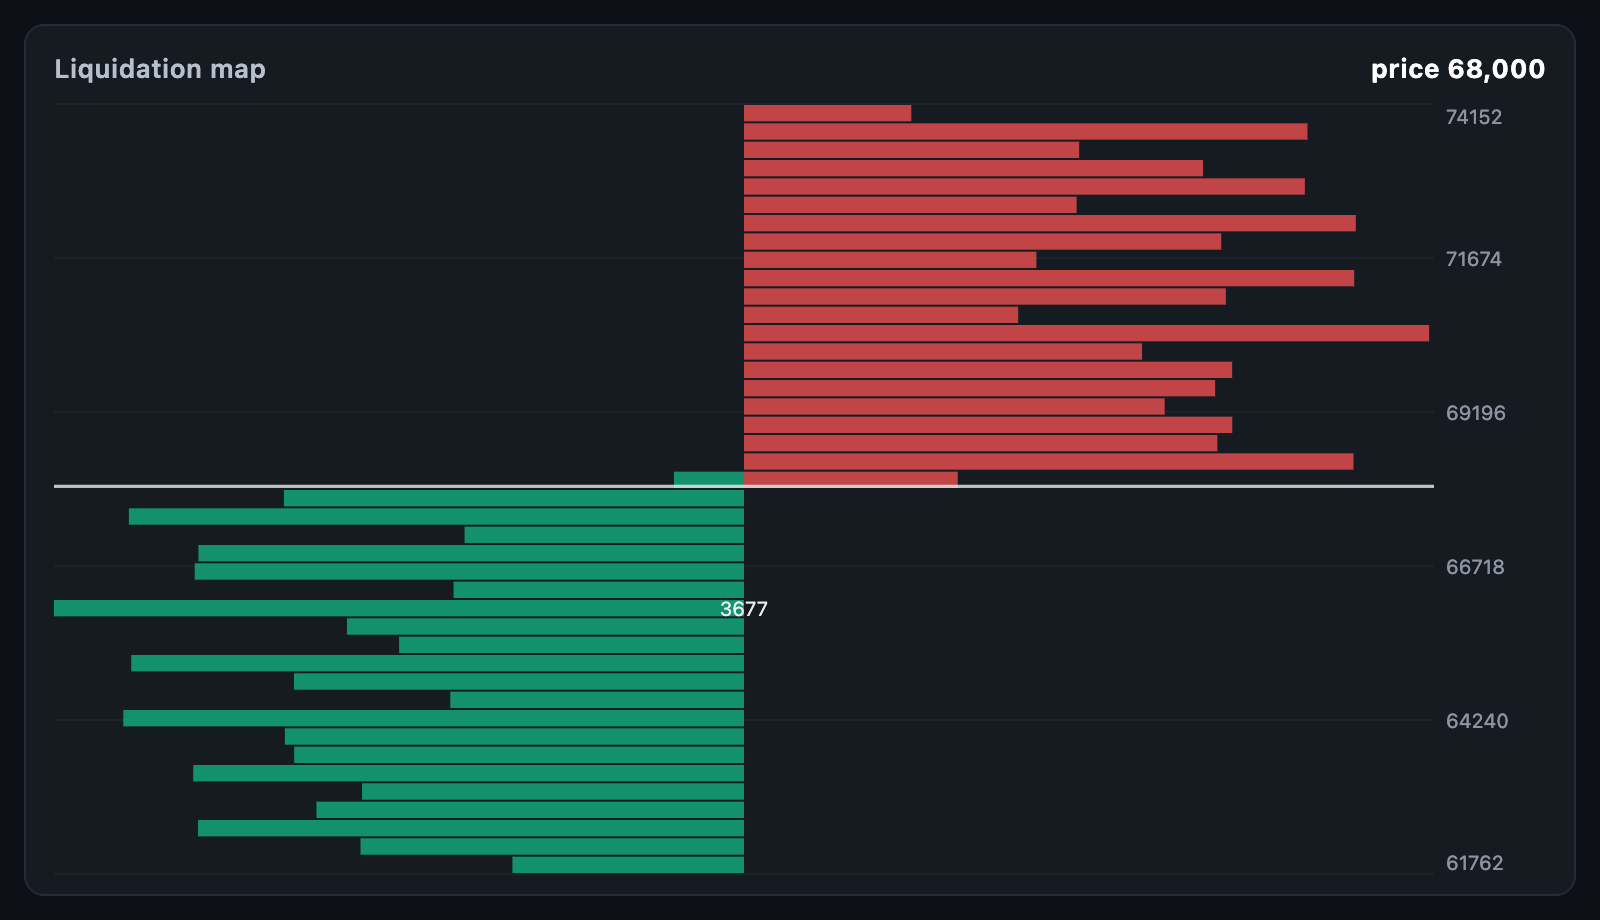 Liquidity map Where the leveraged stops sit, longs below the price and shorts above. |
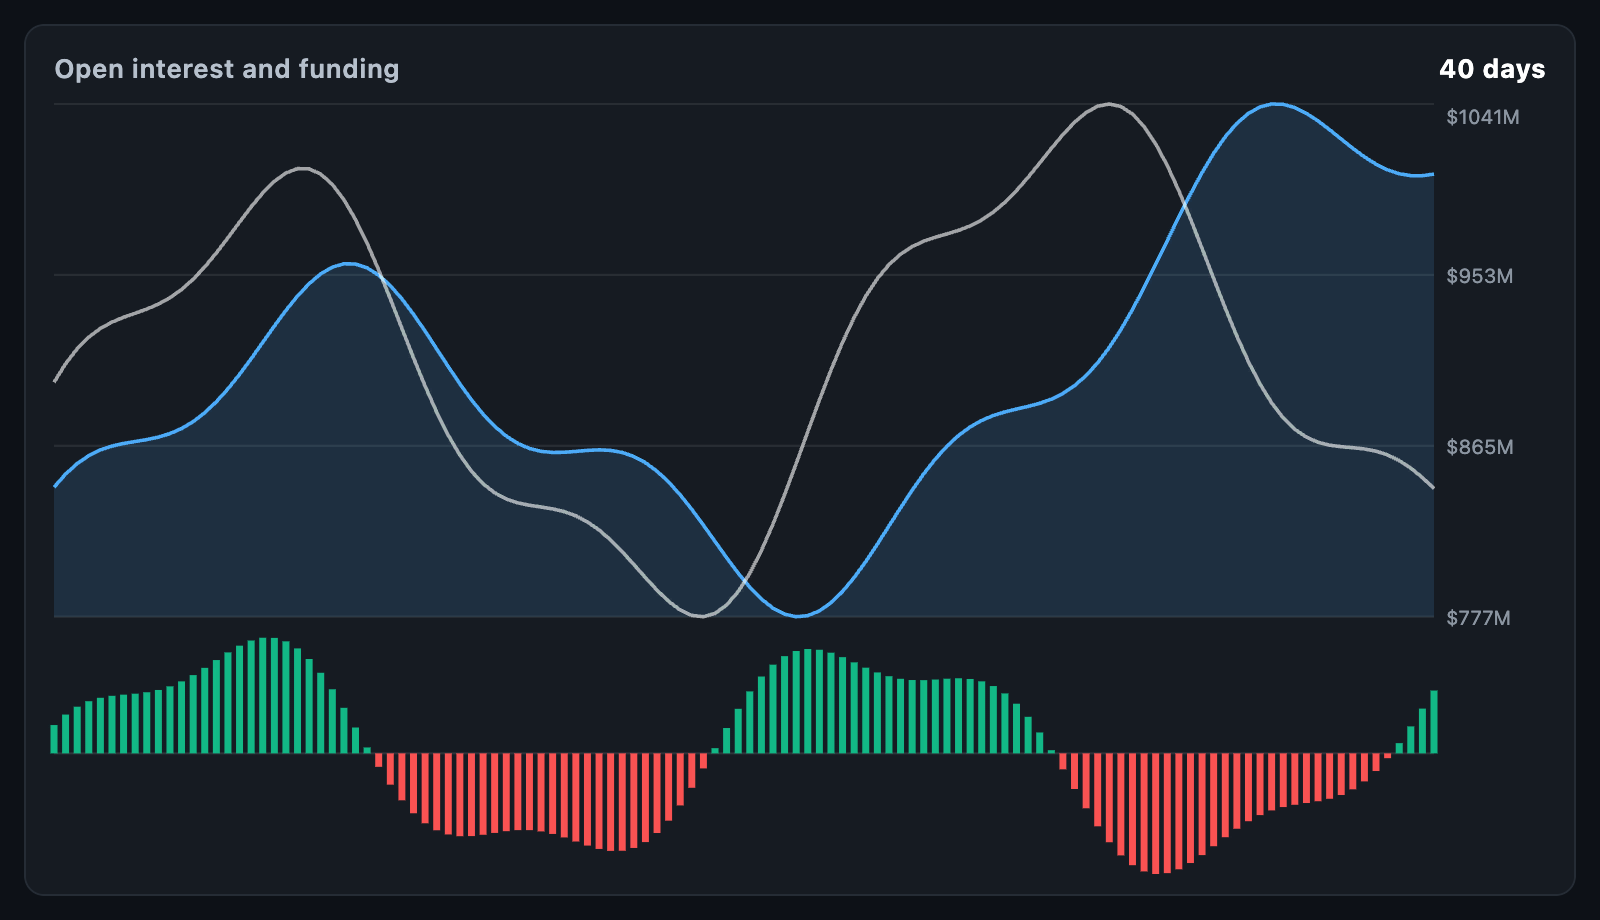 Open interest and funding How much money is in the trade, and which side is paying. |
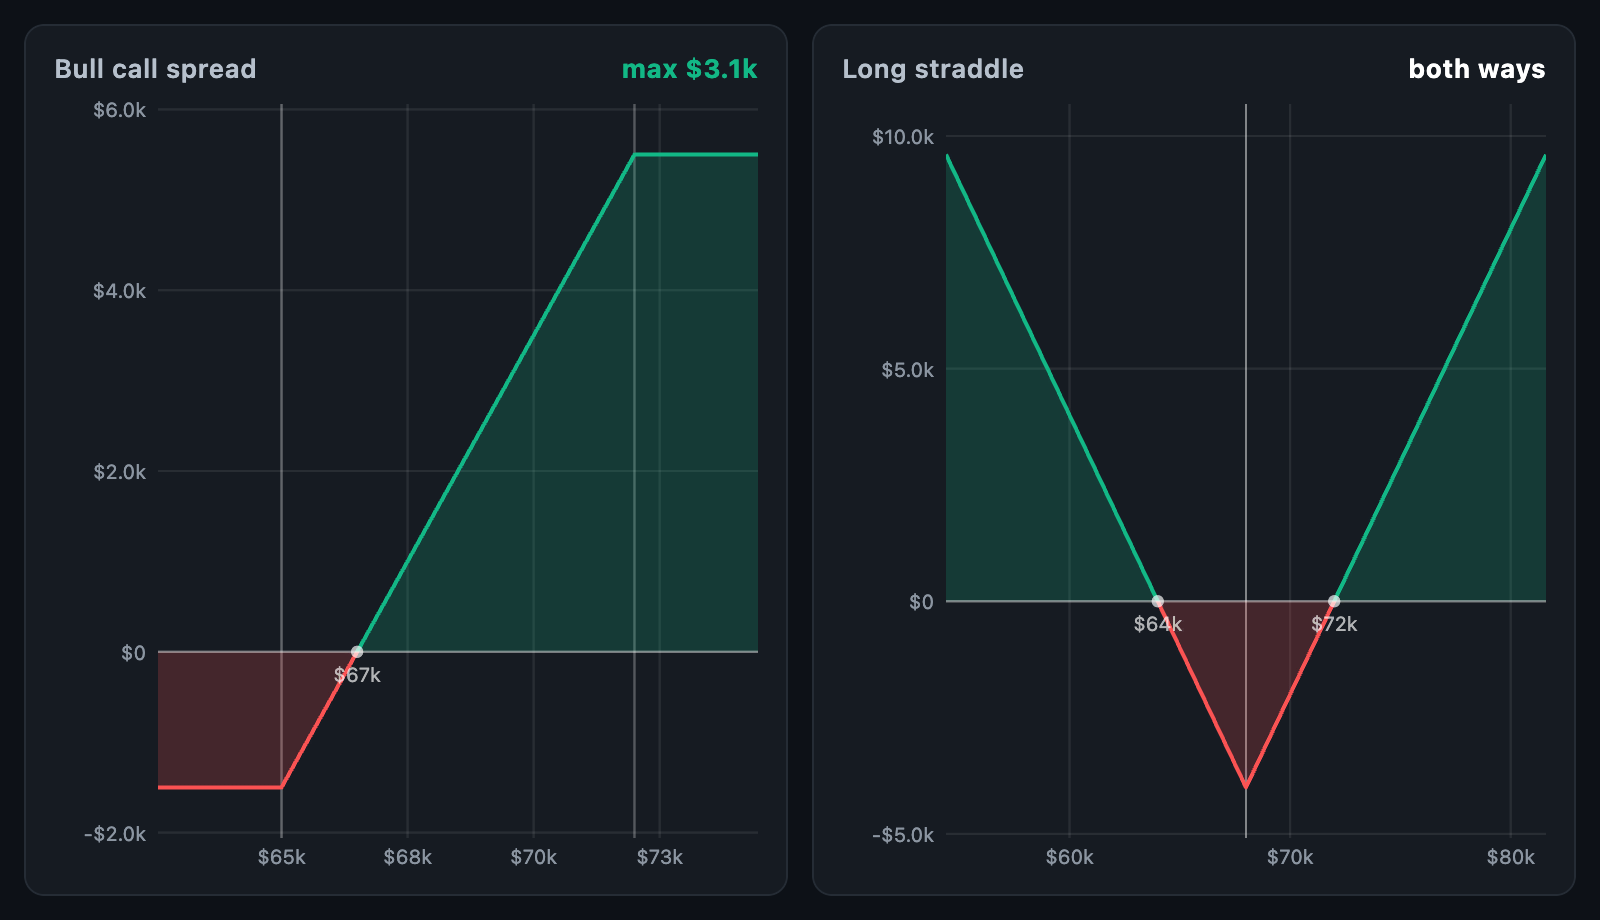 Options payoff A bull call spread and a long straddle at expiry, with break-evens. |
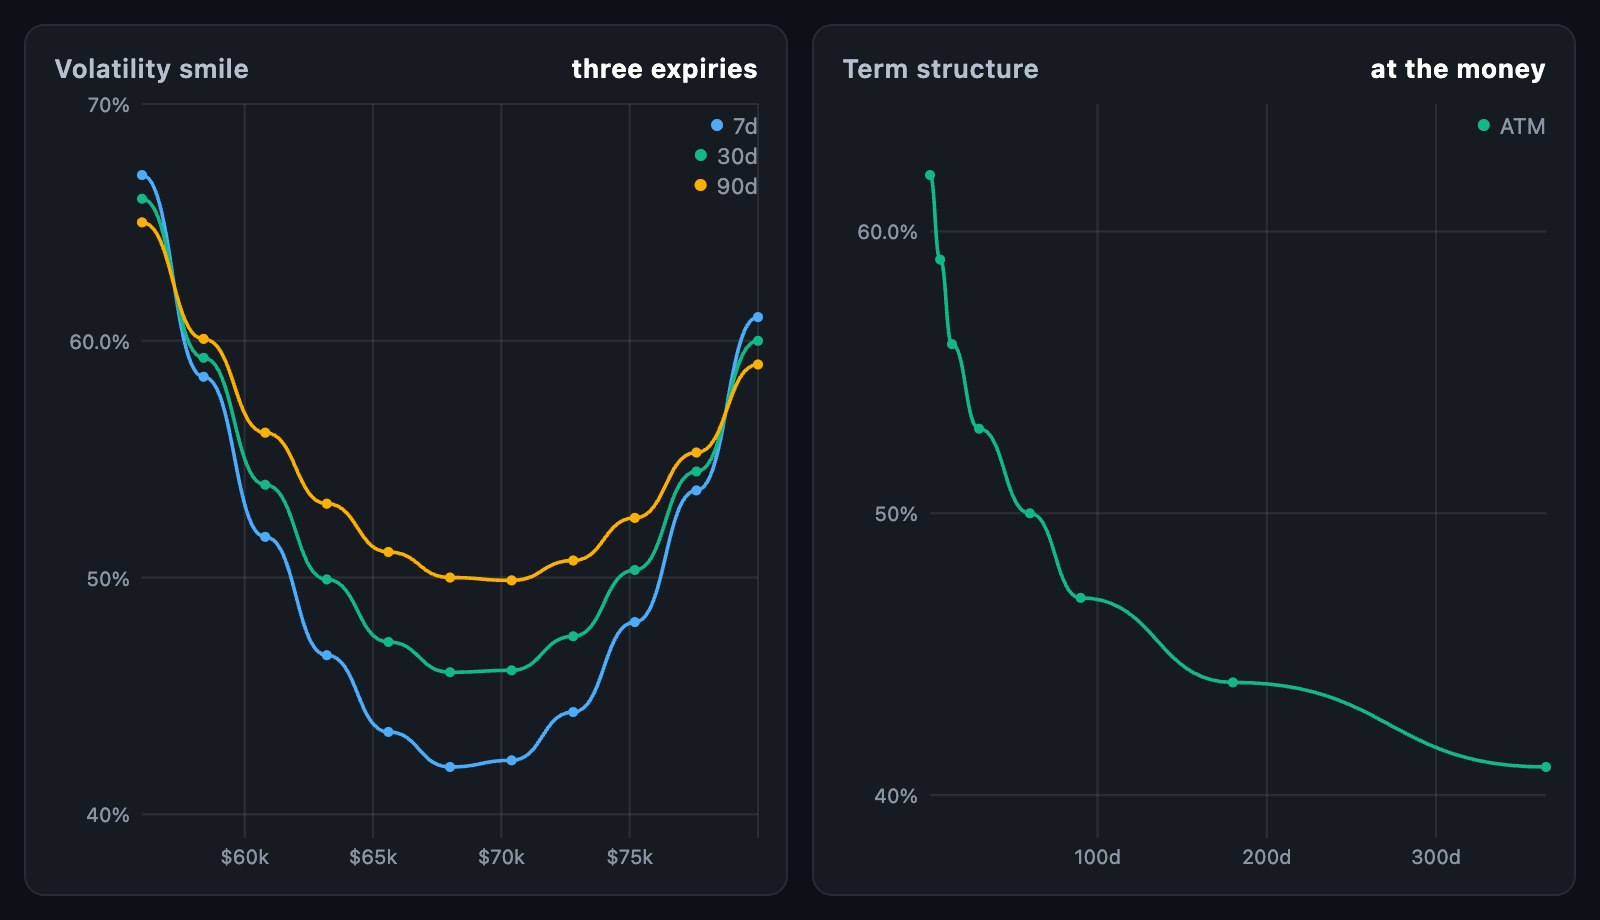 Volatility curves A smile at three expiries, and a term structure. |
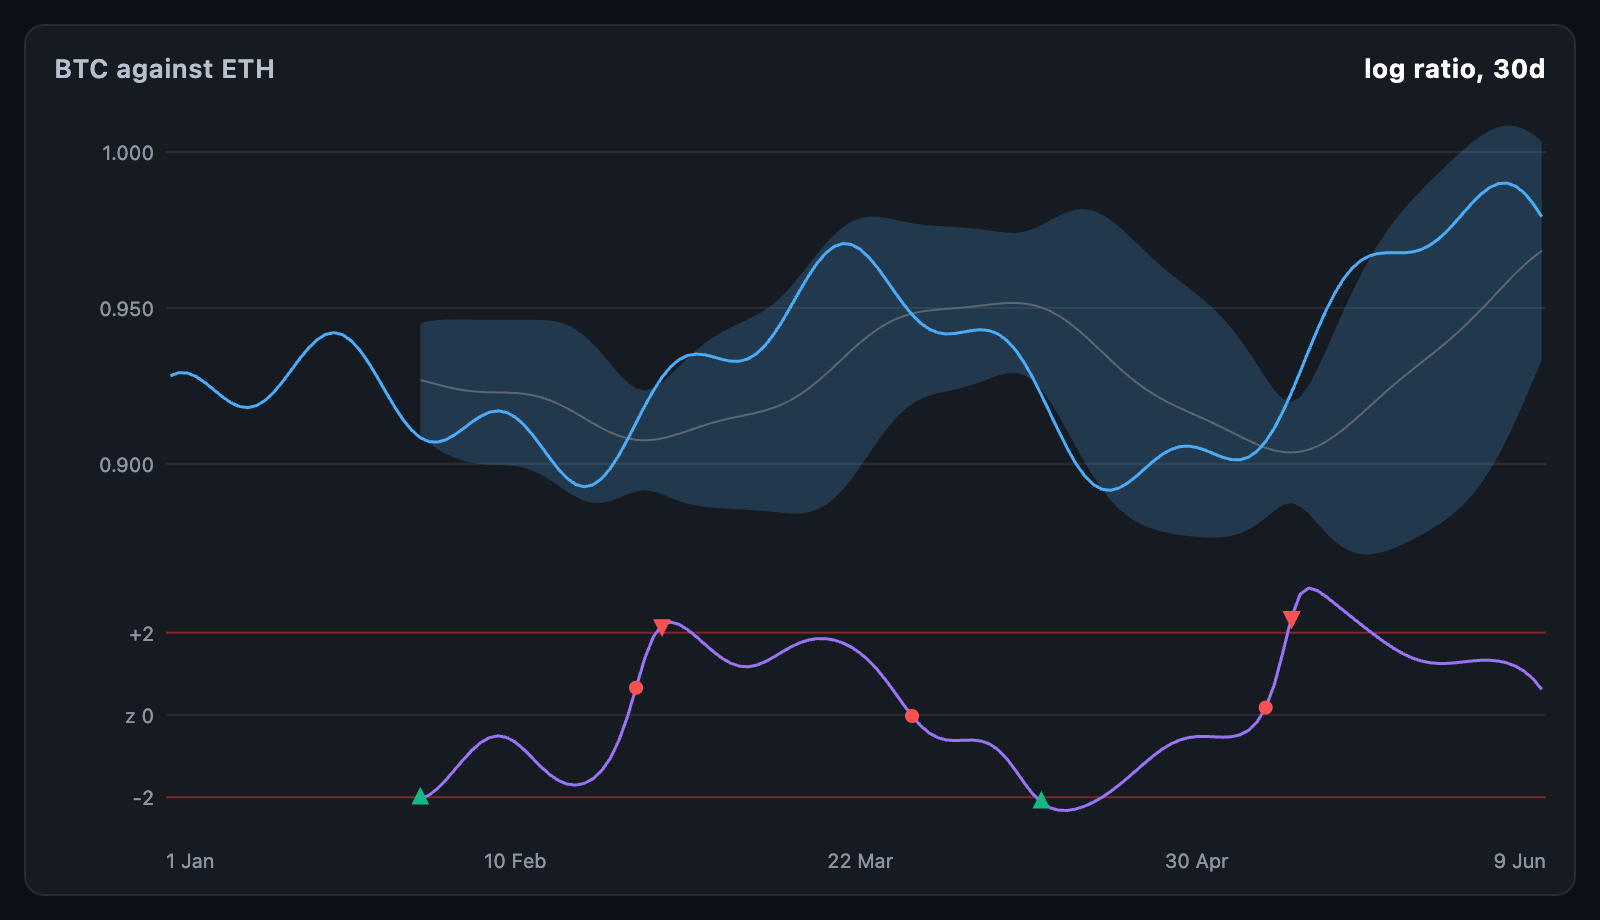 Pair spread The log ratio of two symbols, with bands and a z-score. |
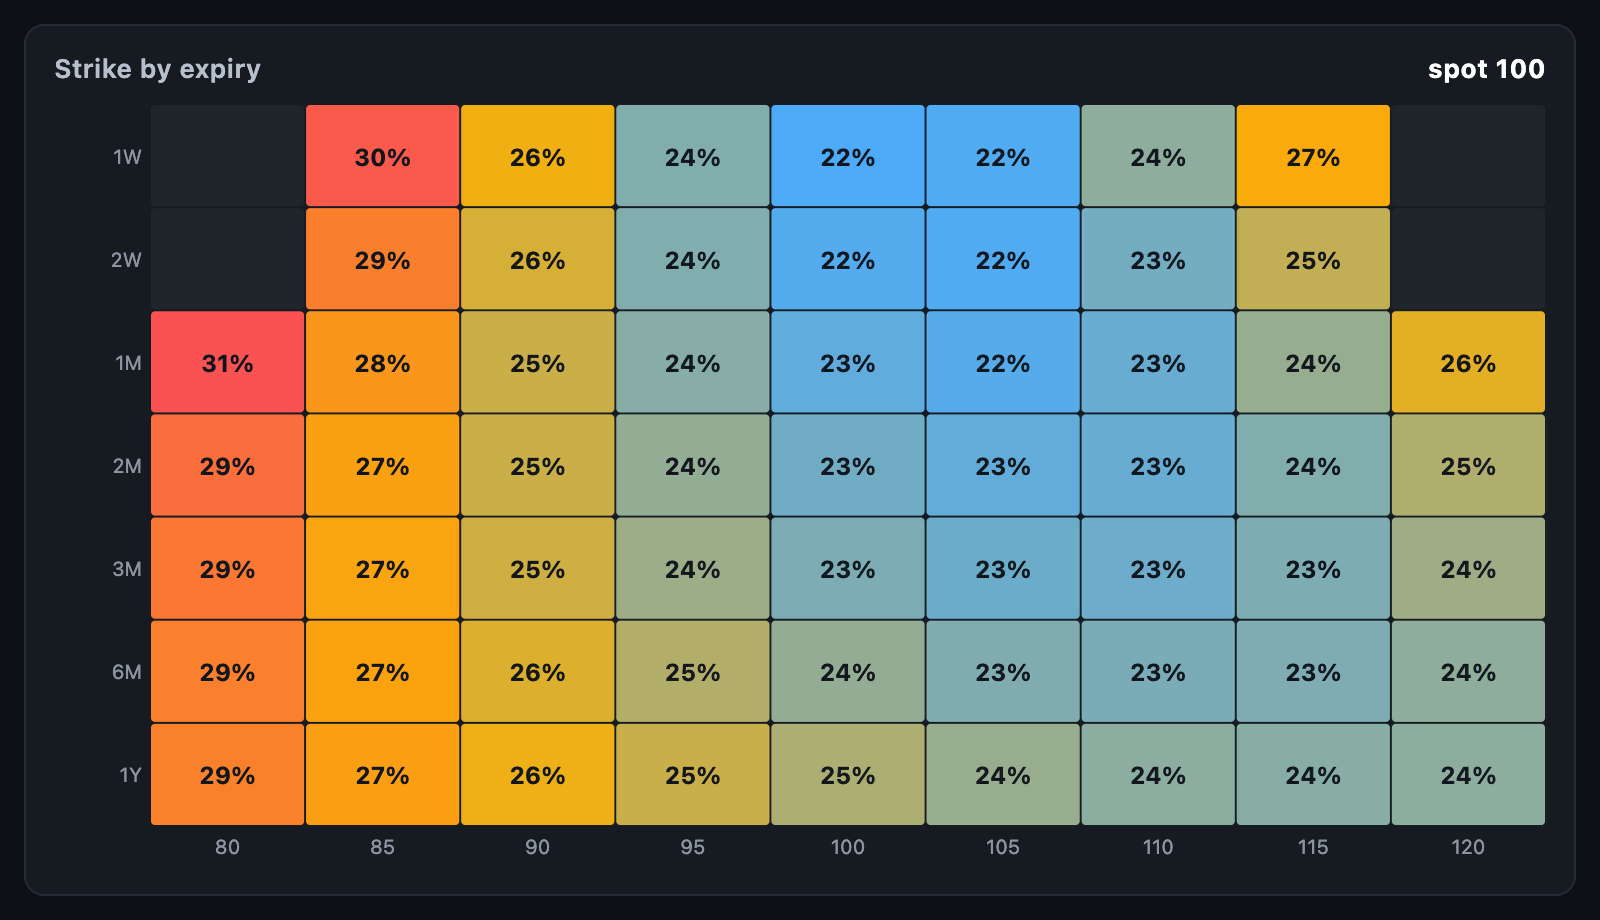 Volatility surface Implied volatility across strike and expiry, with the skew against the money. |
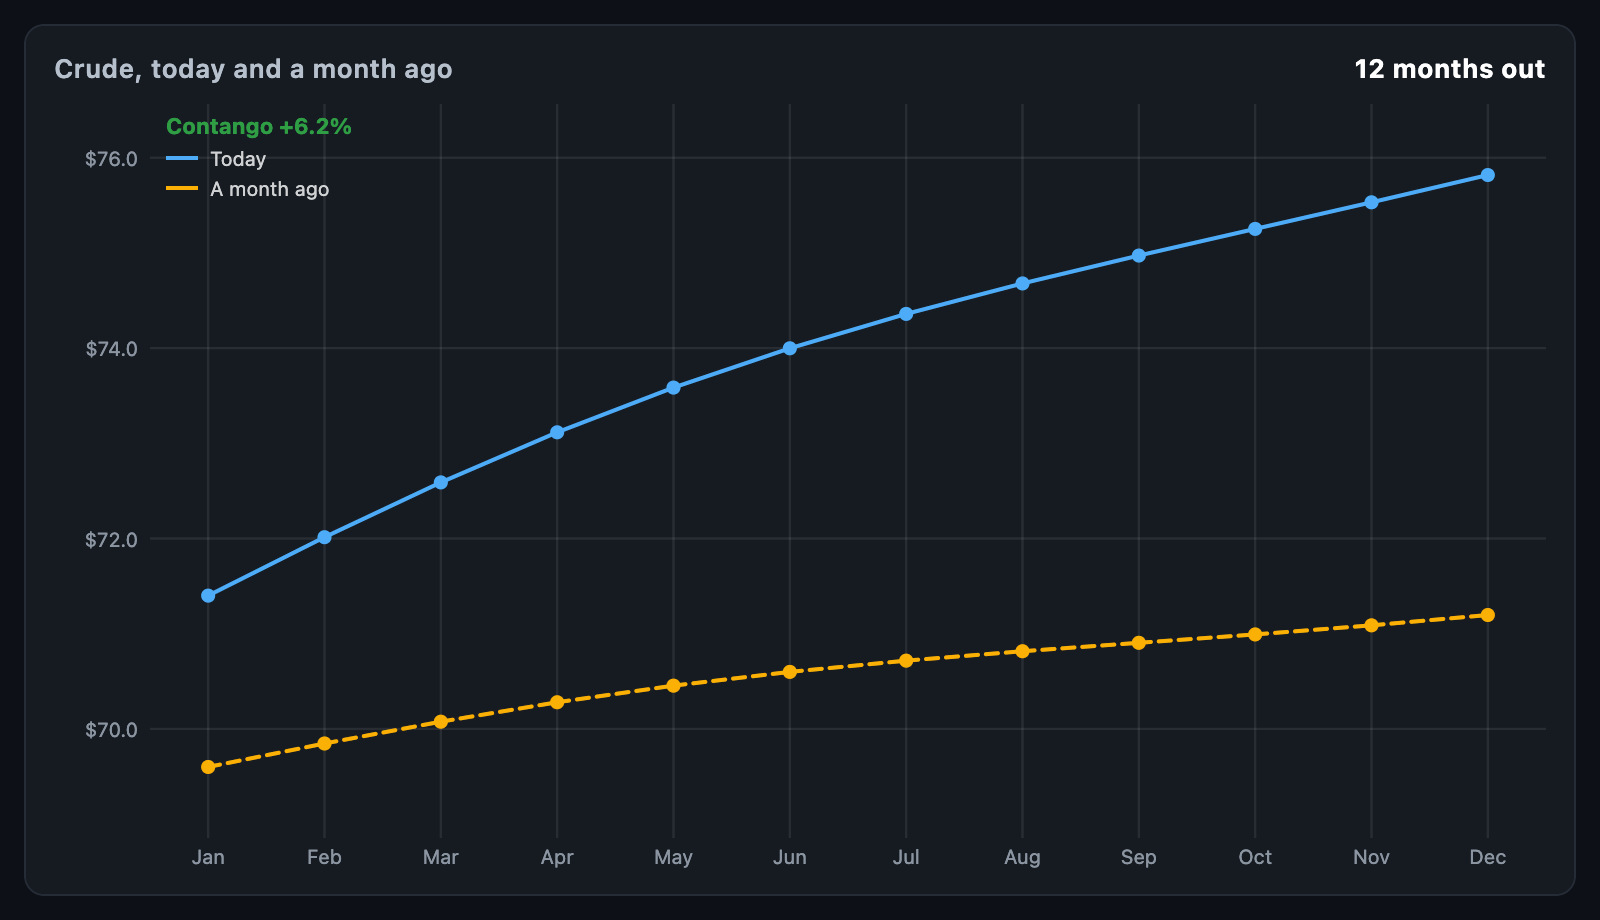 Futures curve Prices by delivery month, with contango or backwardation read off. |
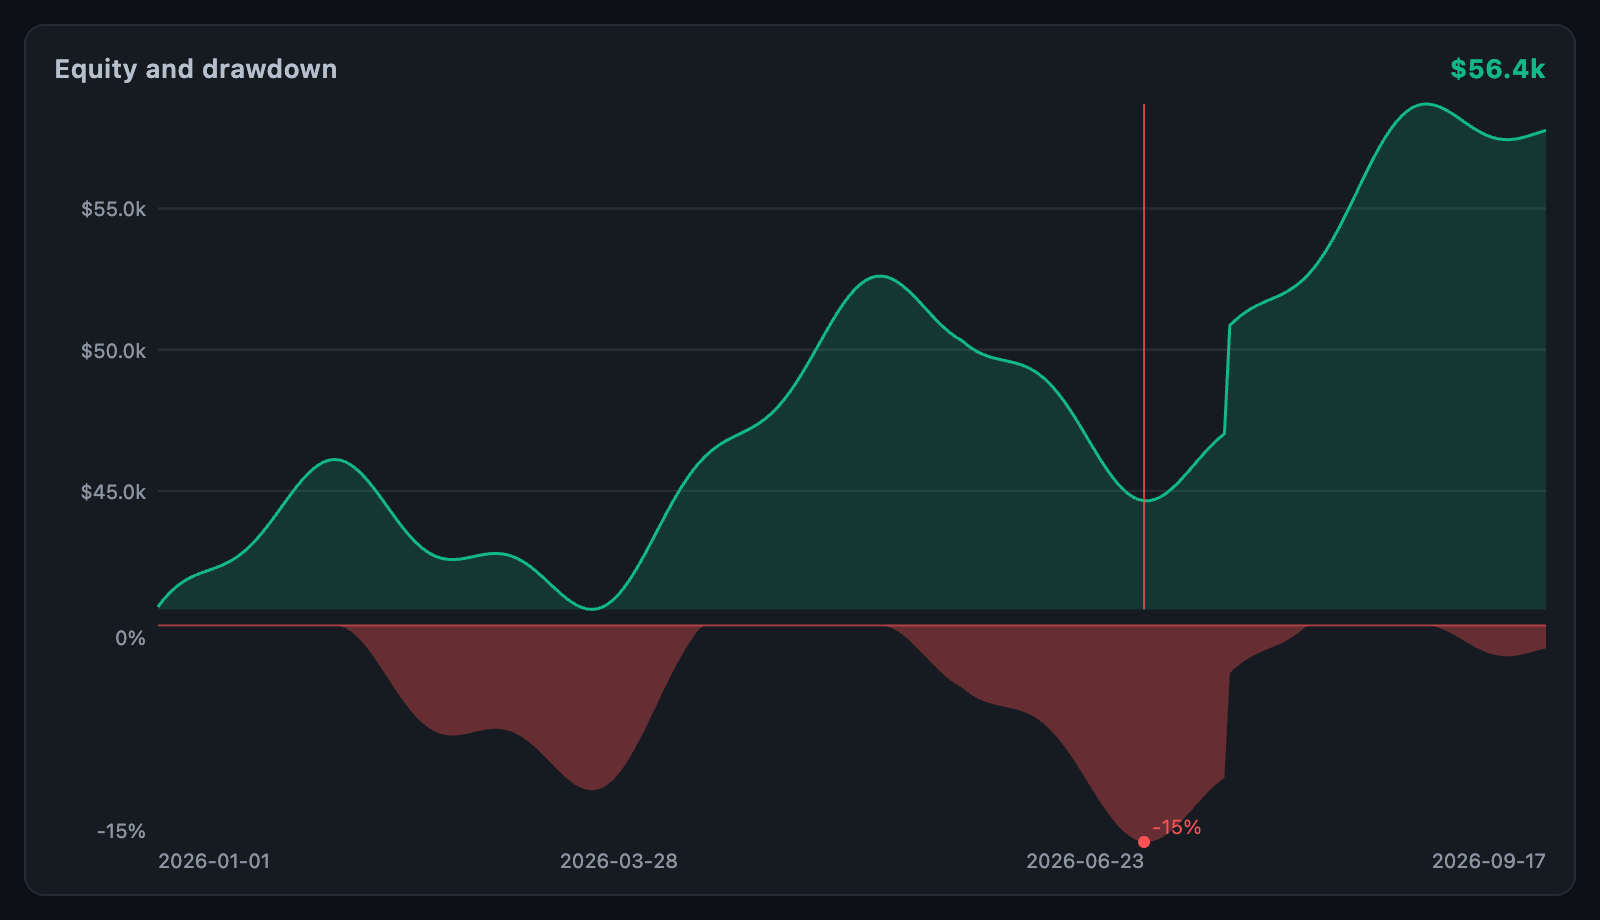 Equity curve The curve, with the underwater drawdown panel beneath it. |
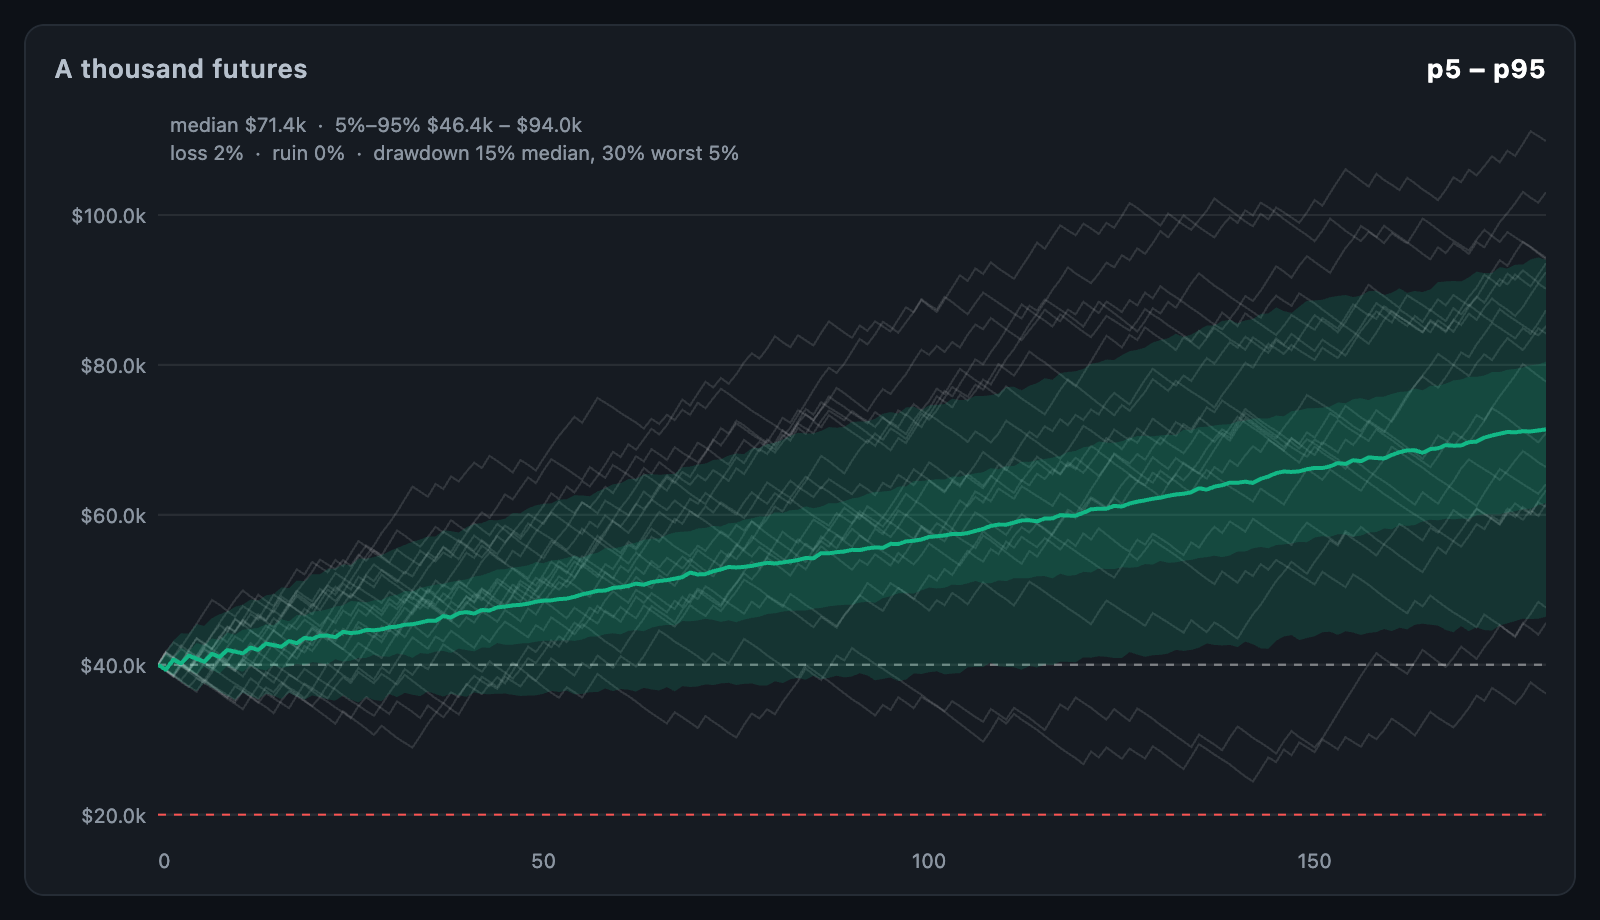 Monte Carlo fan Simulated paths as percentile bands, with the odds of loss and ruin. |
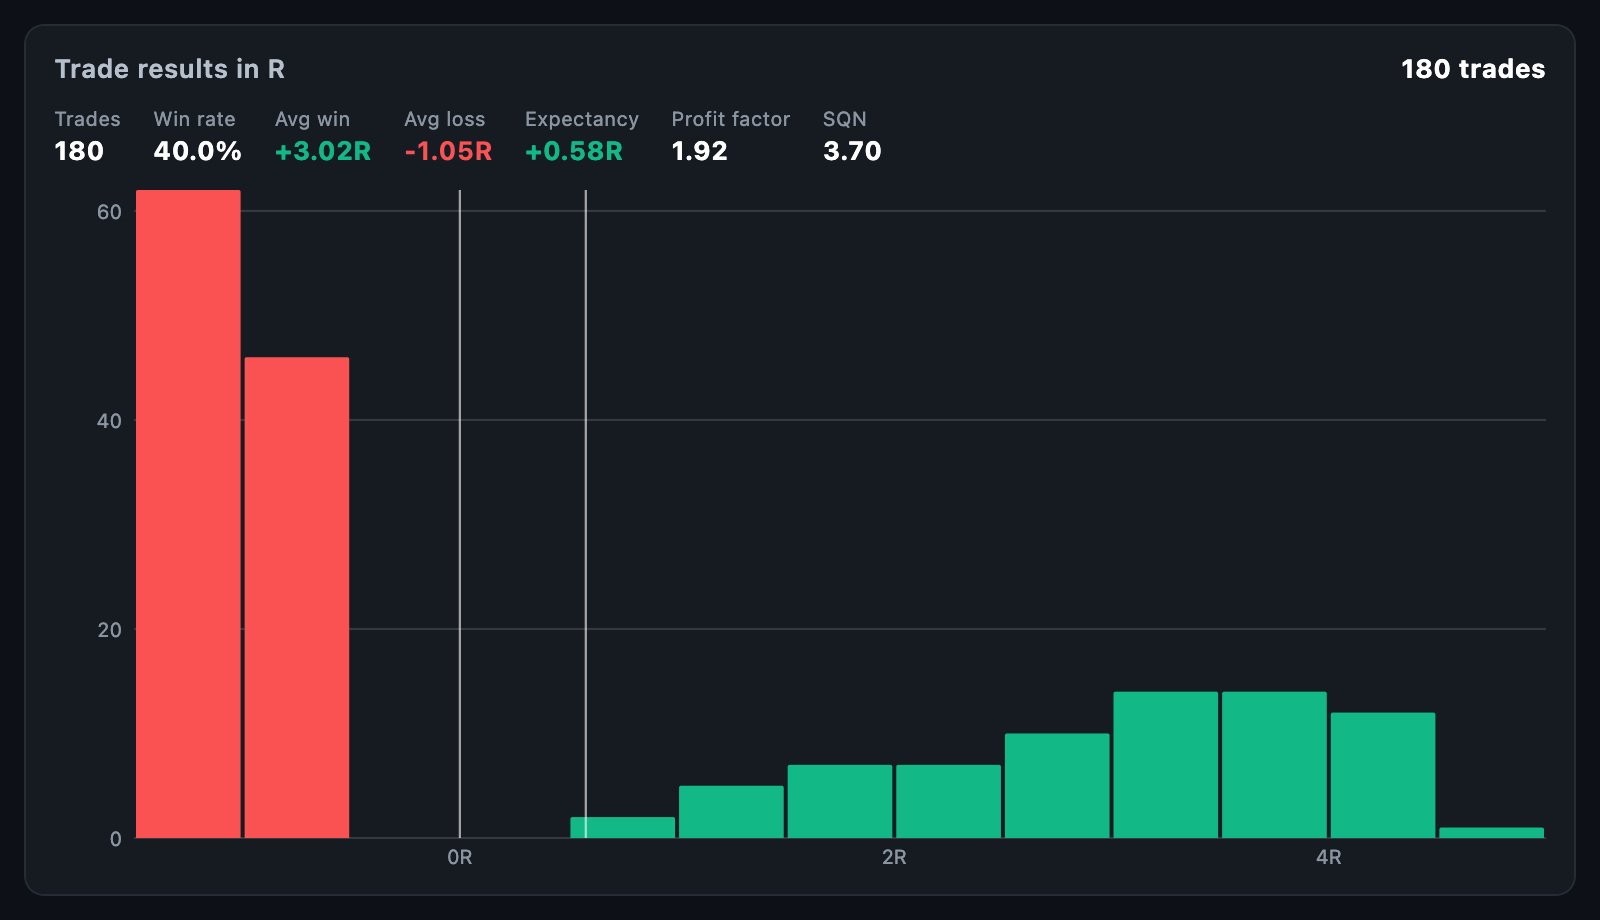 R-multiple distribution Results in R, with expectancy, profit factor and SQN. |
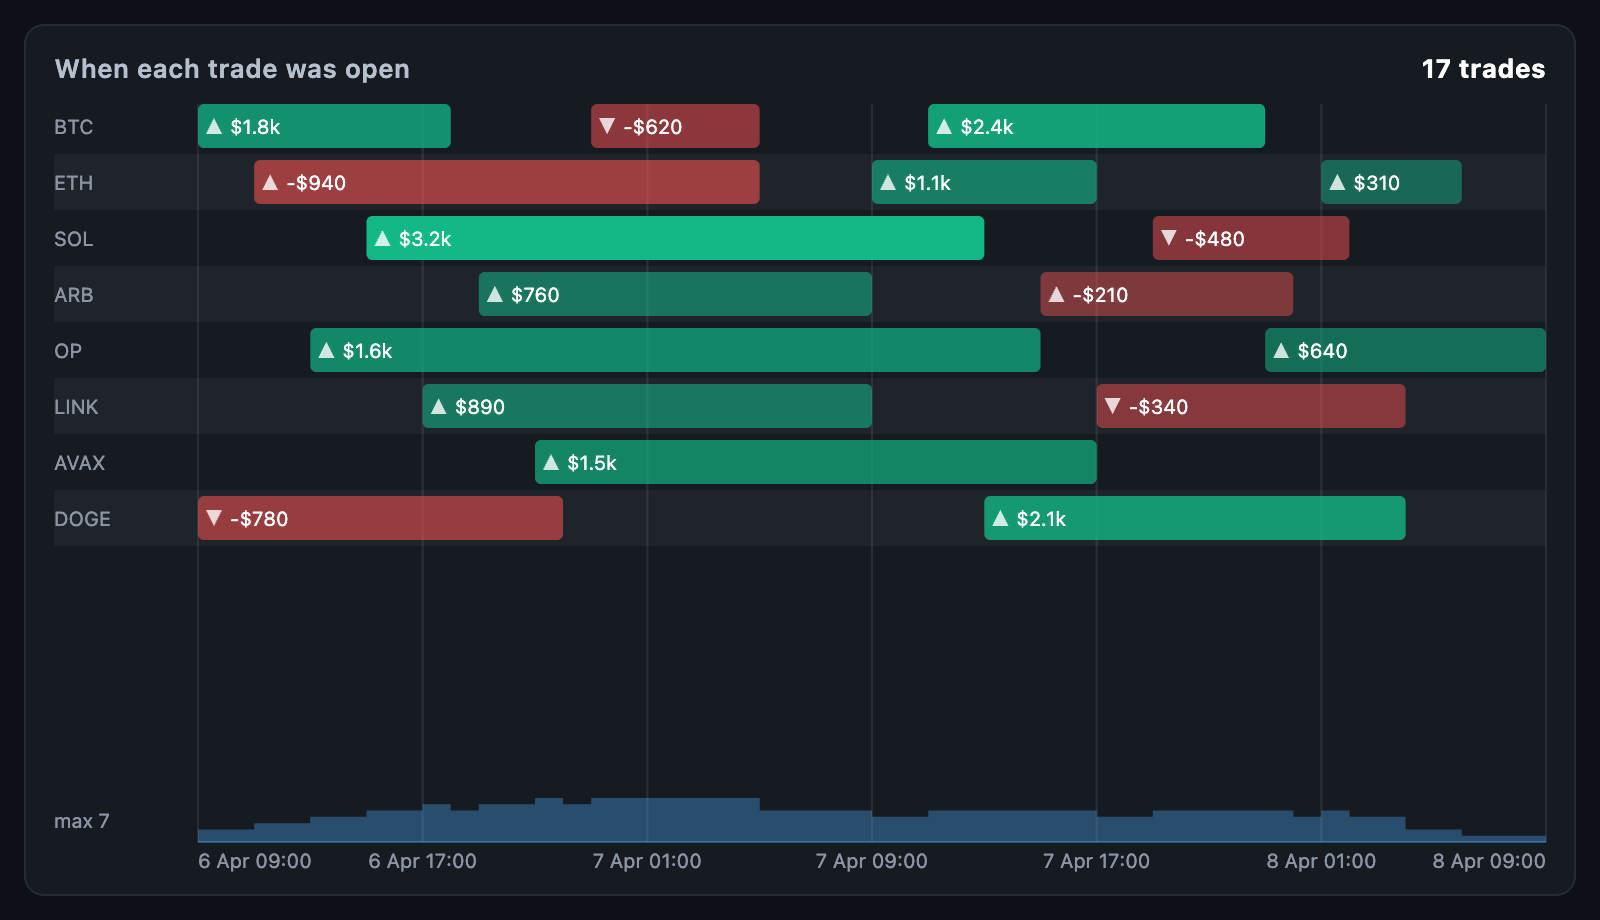 Trade timeline Every trade from entry to exit, a lane per symbol. |
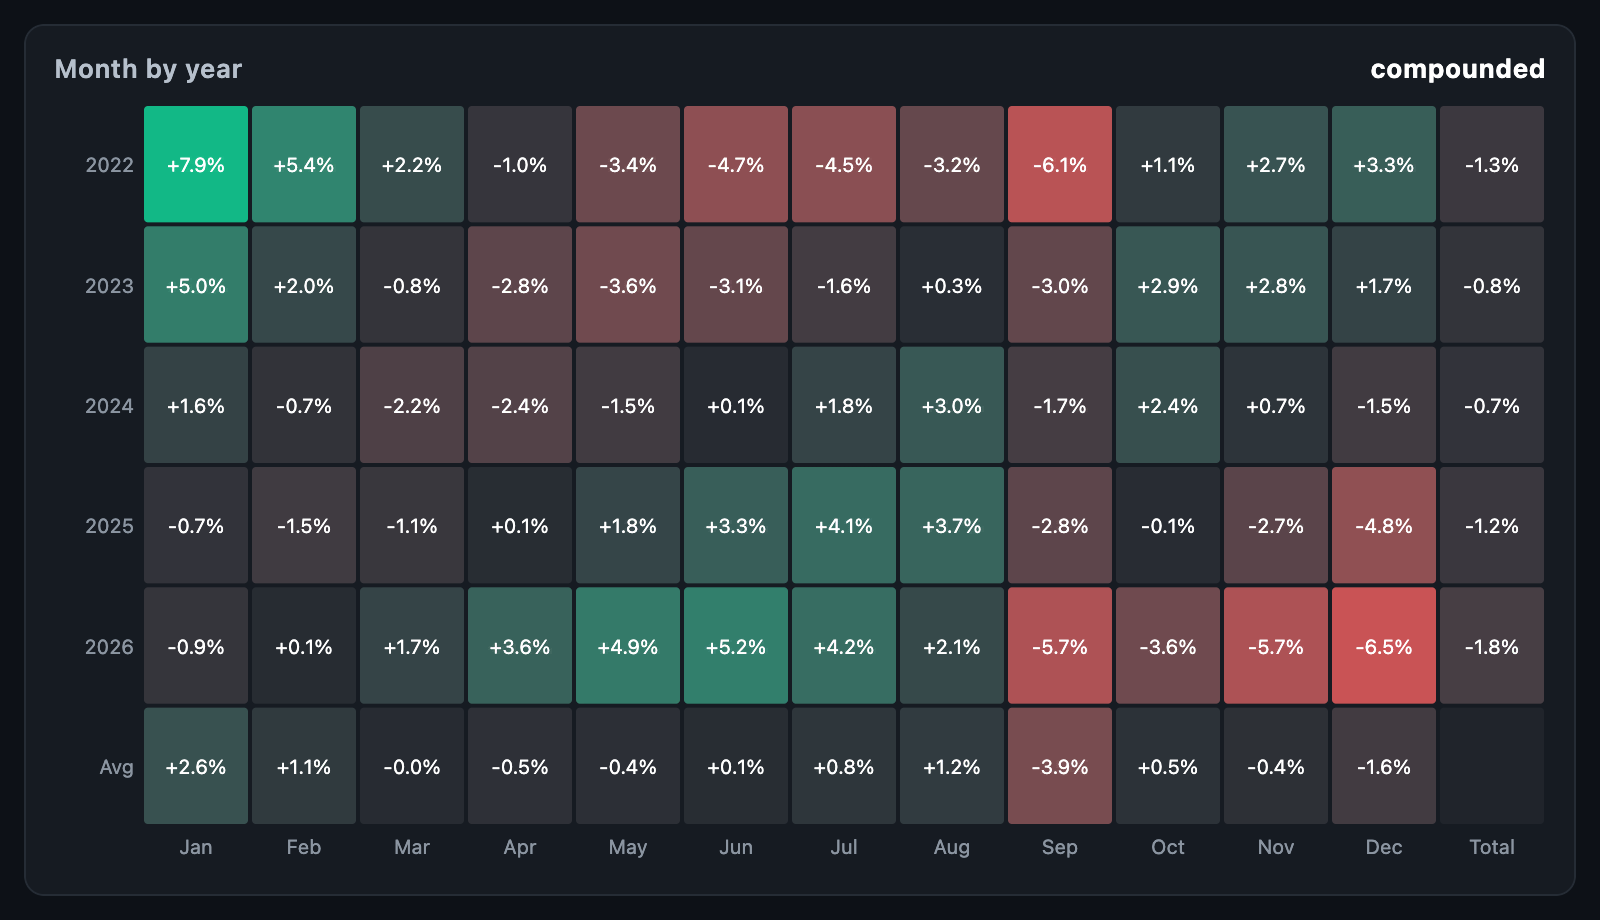 Seasonality Returns by month and year, compounded, with totals and averages. |
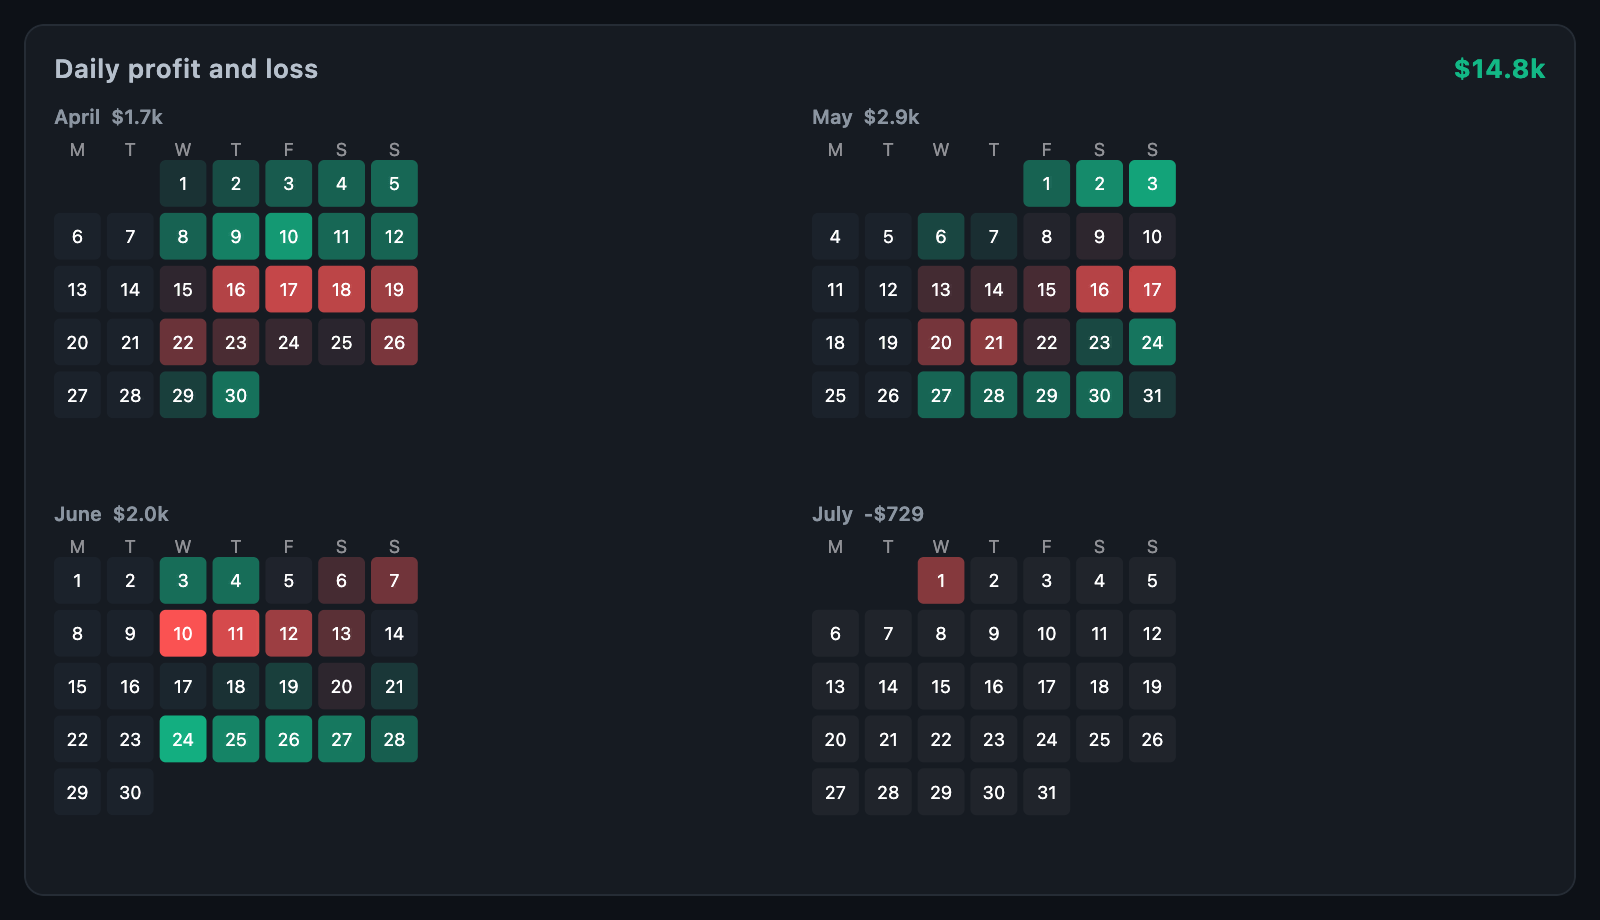 Calendar Daily profit and loss on real month panels. |
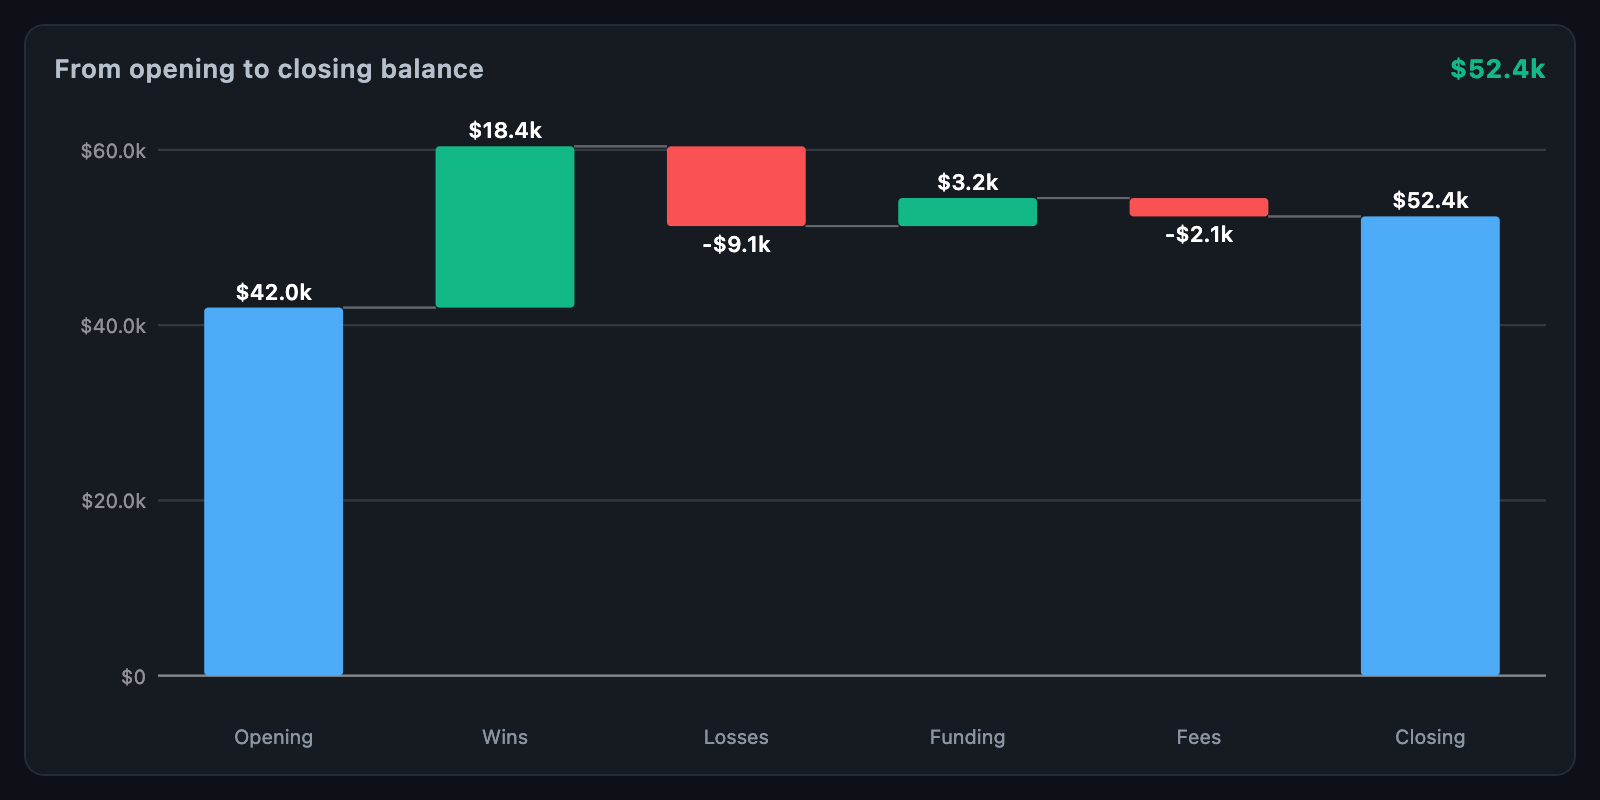 Waterfall A balance built up step by step, from opening to closing. |
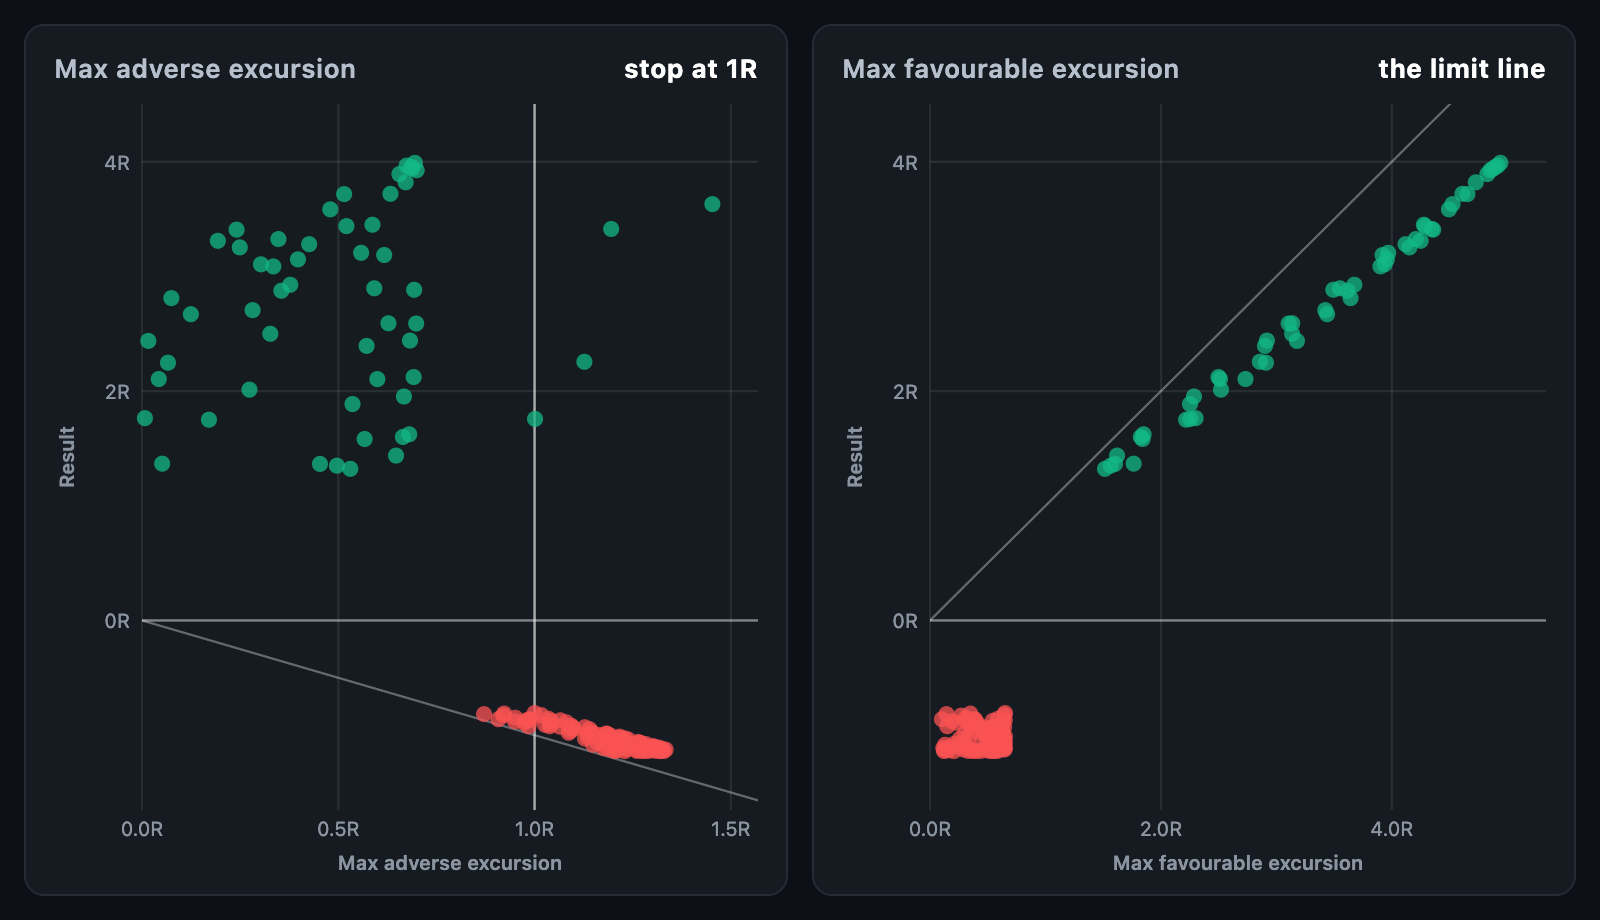 MAE / MFE scatter Every trade by how far it went against you or for you, and what it made. |
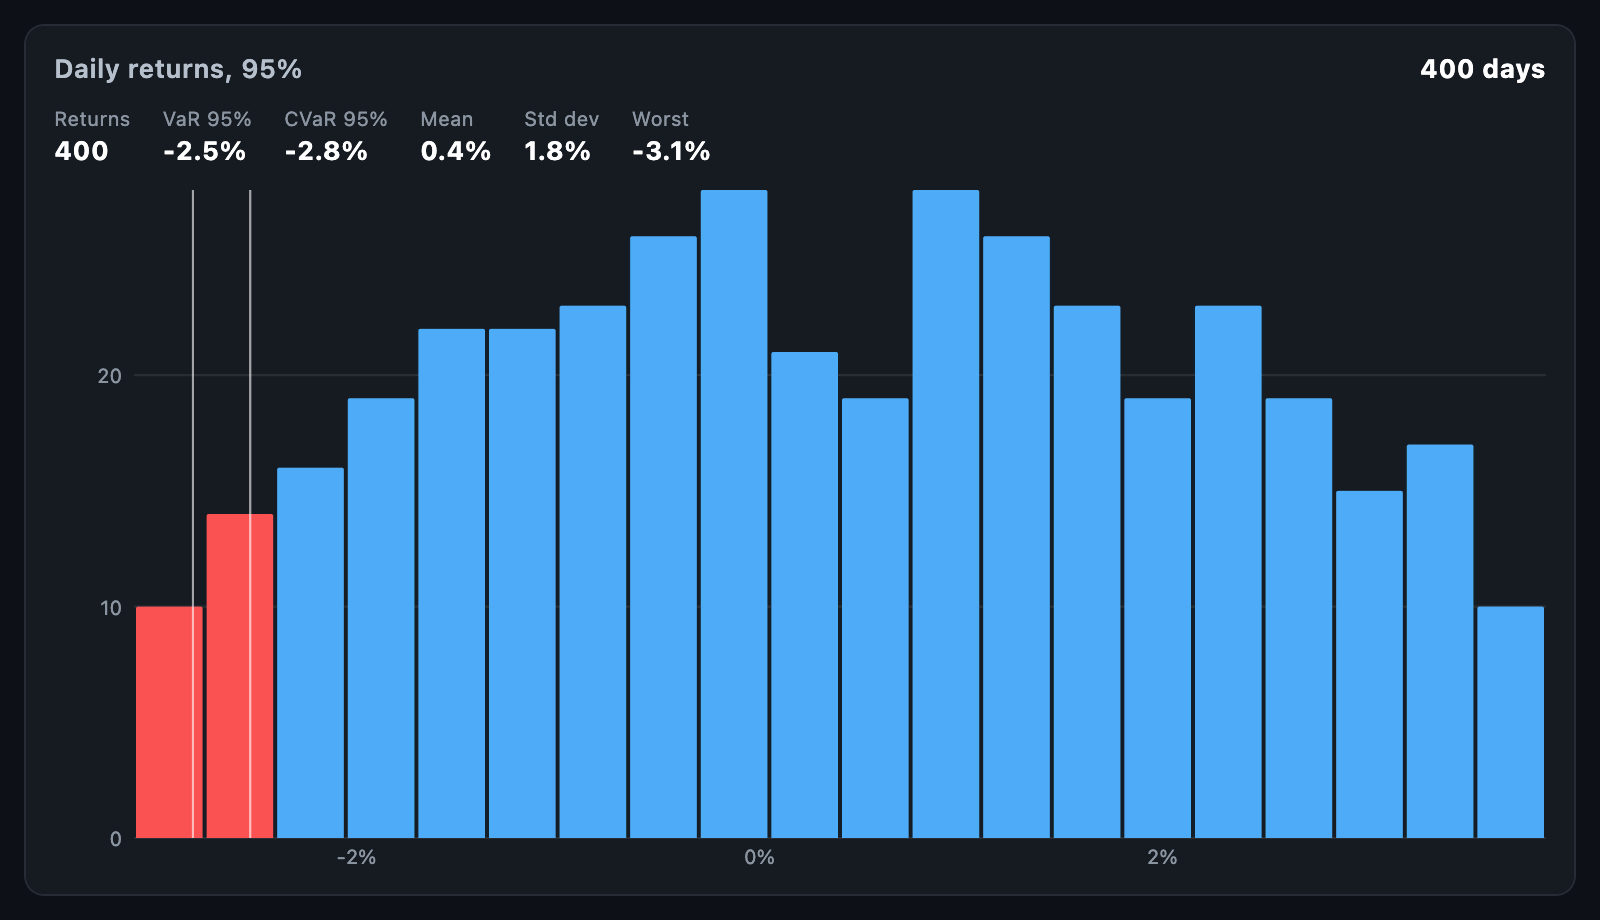 Value at risk Returns with the loss tail picked out, and VaR and expected shortfall marked. |
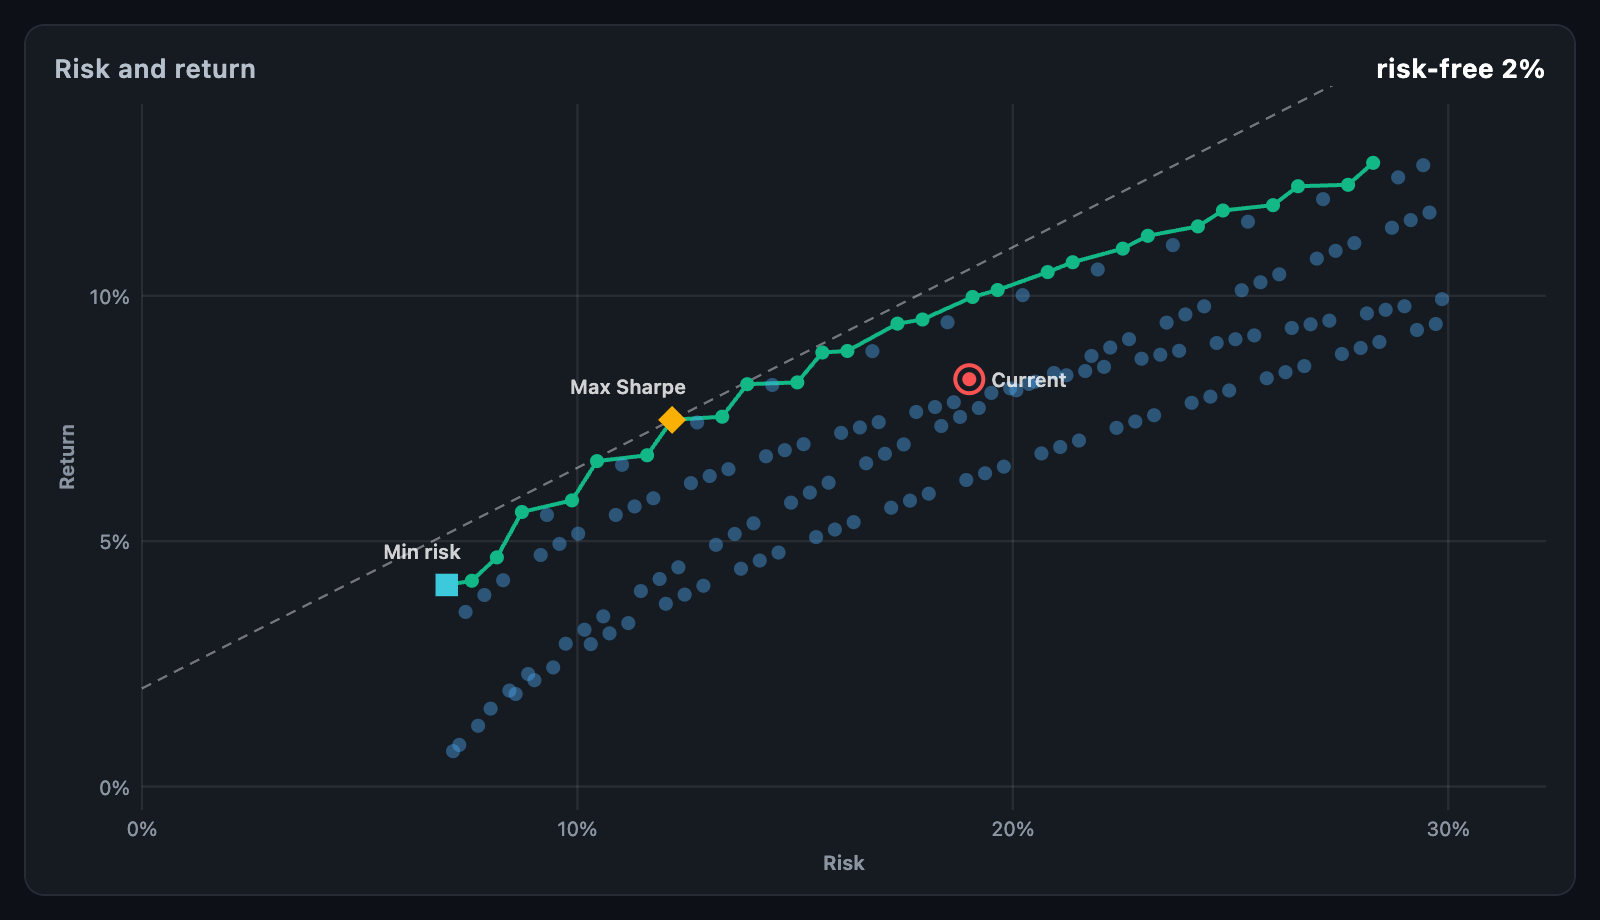 Efficient frontier Portfolios by risk and return, with the frontier and the best Sharpe ratio. |
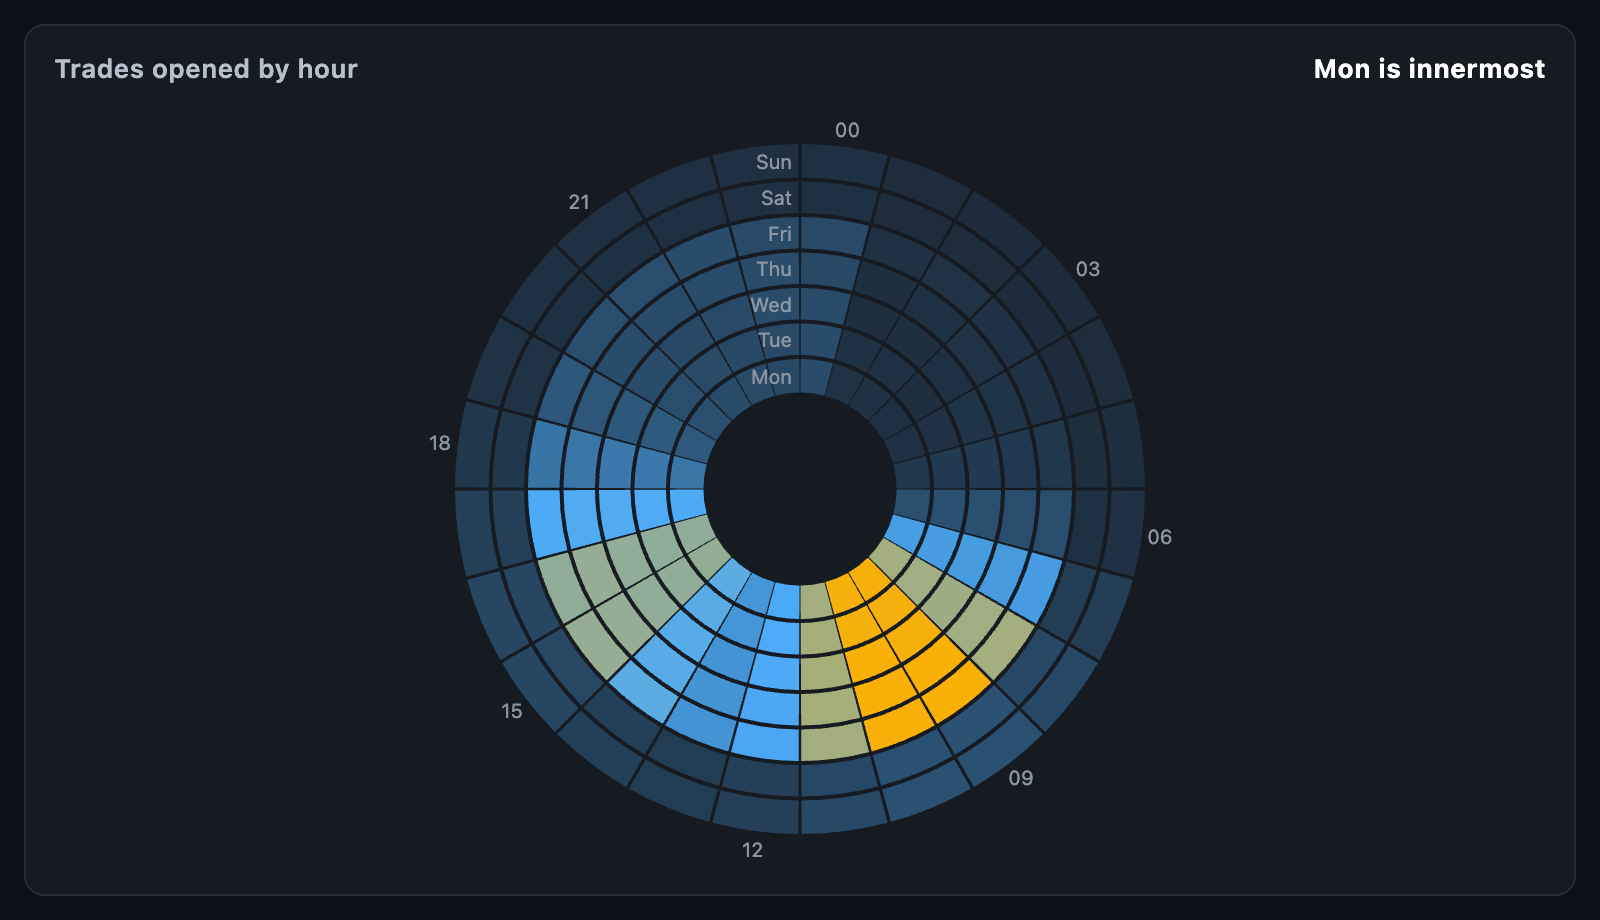 Activity clock A week as a clock face: an hour round the dial, a weekday on each ring. |
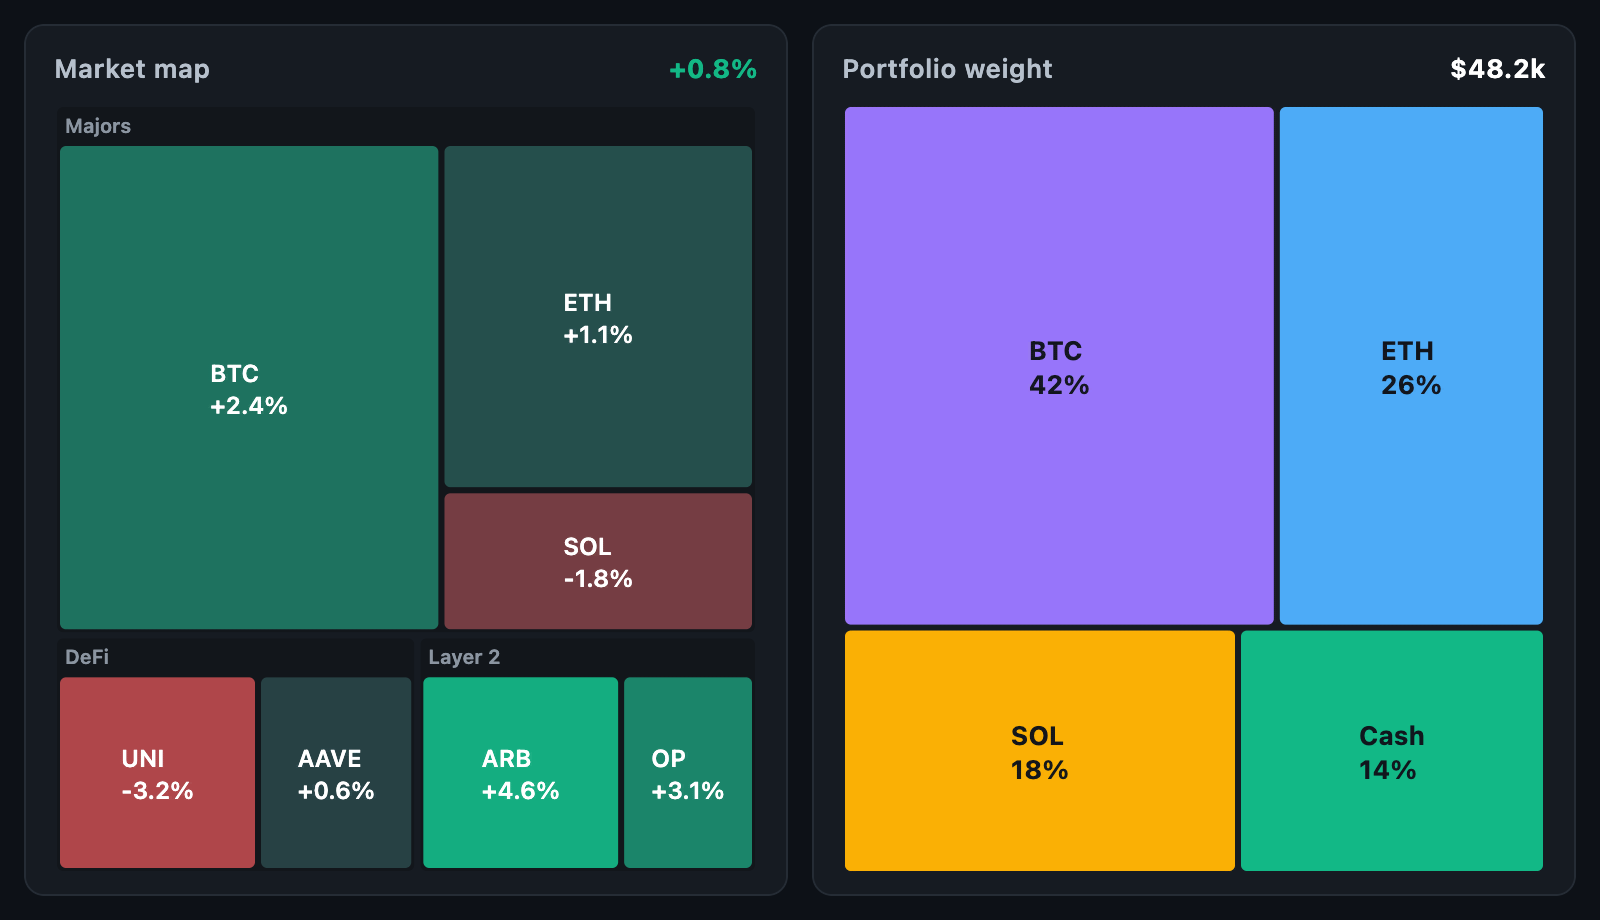 Treemap A market map of sectors and symbols, and portfolio weight. |
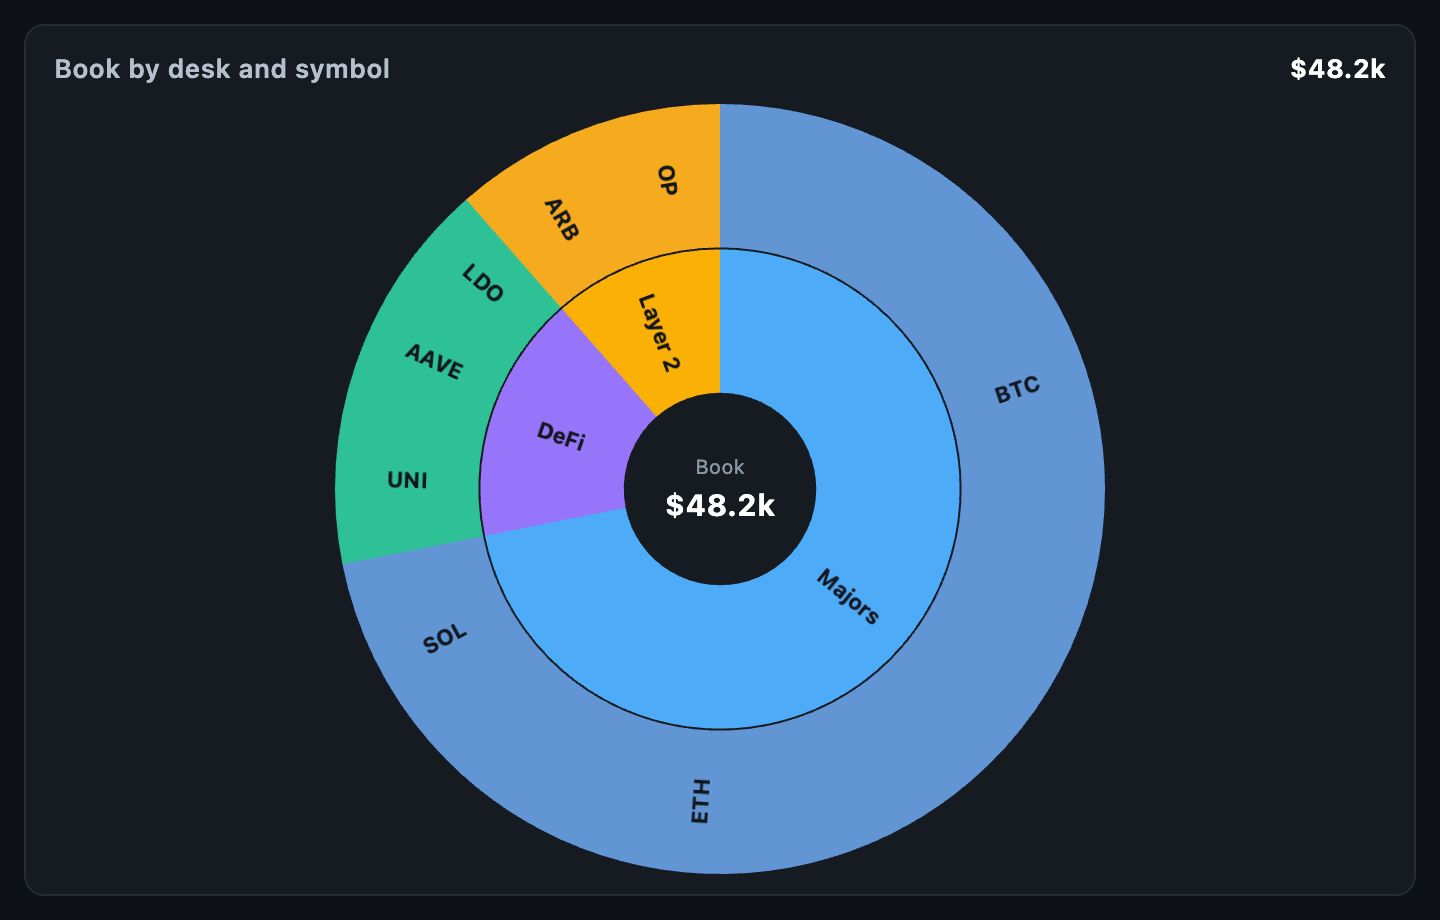 Sunburst A hierarchy as rings, with the total in the middle. |
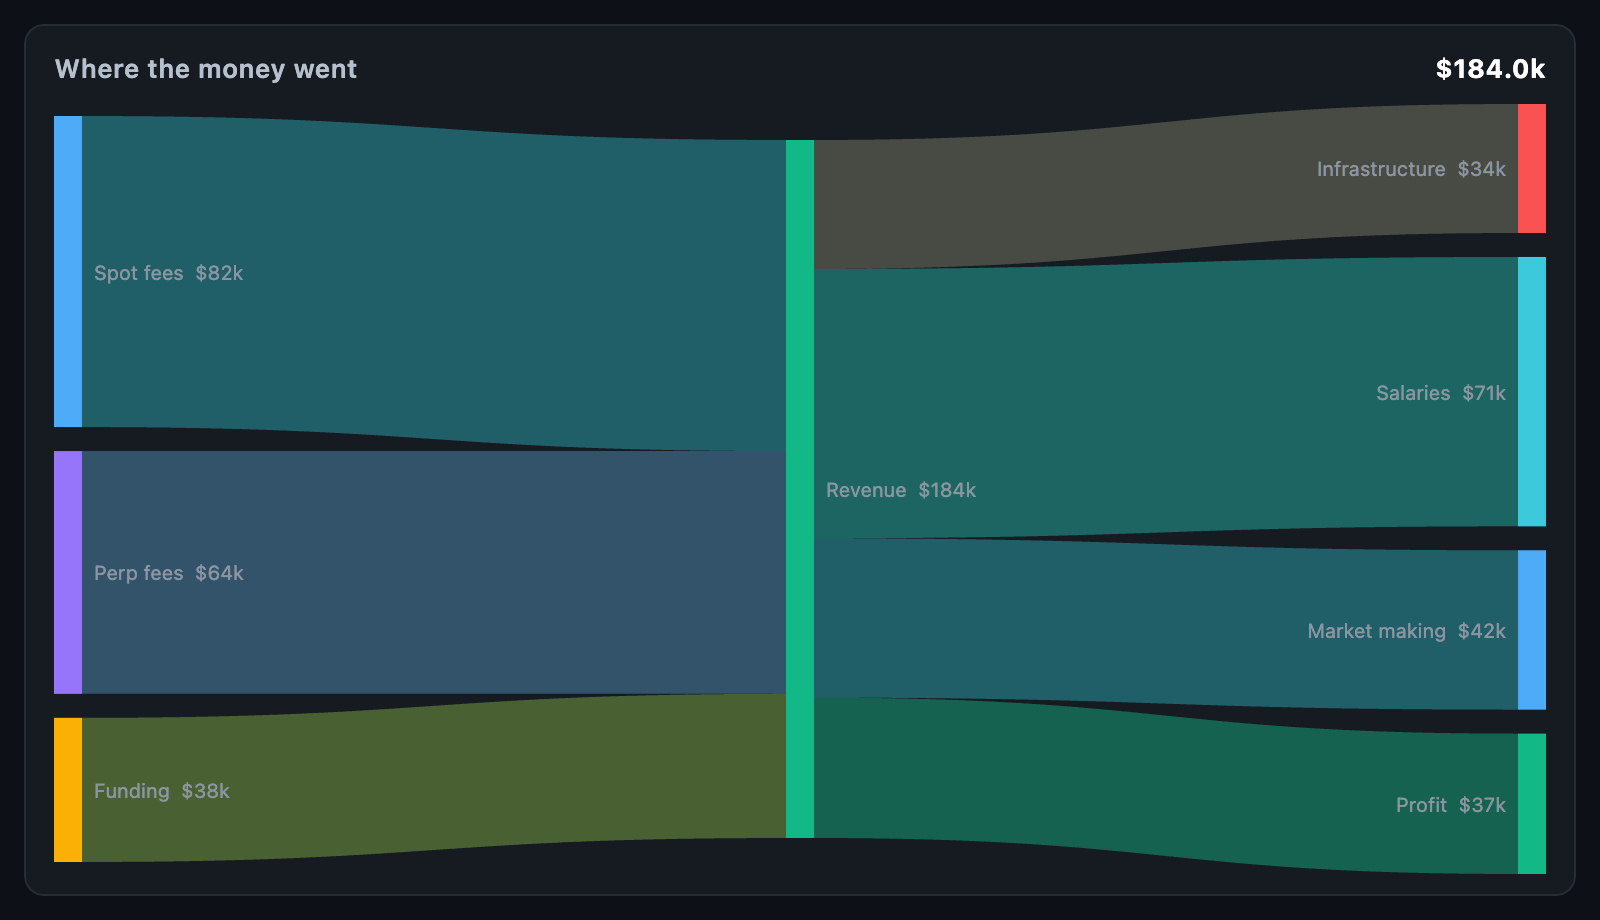 Sankey Fee income flowing through revenue into costs and profit. |
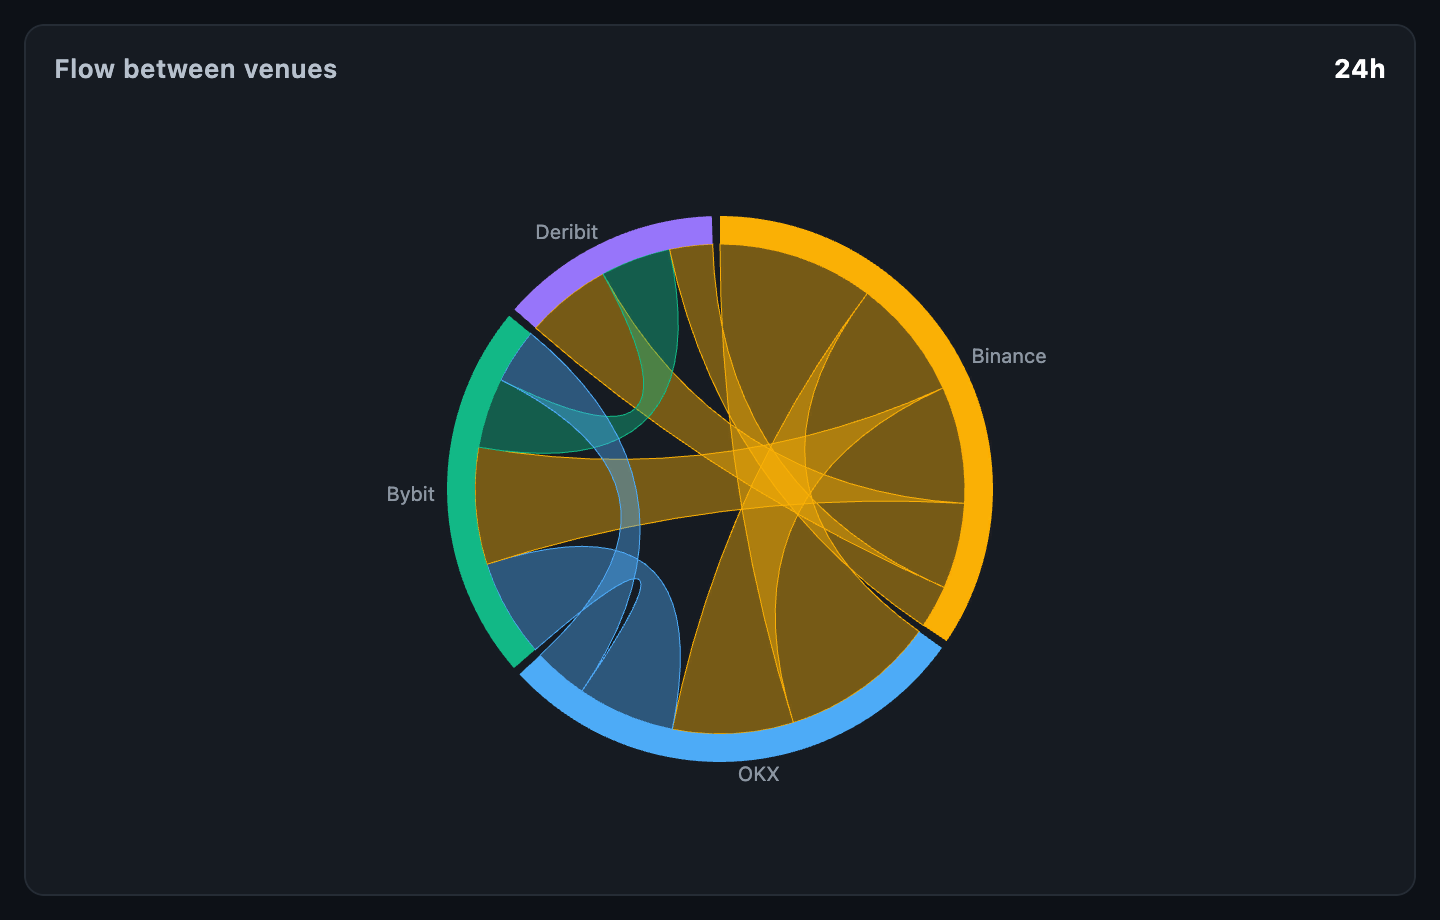 Chord Flow between venues, both ways round a ring. |
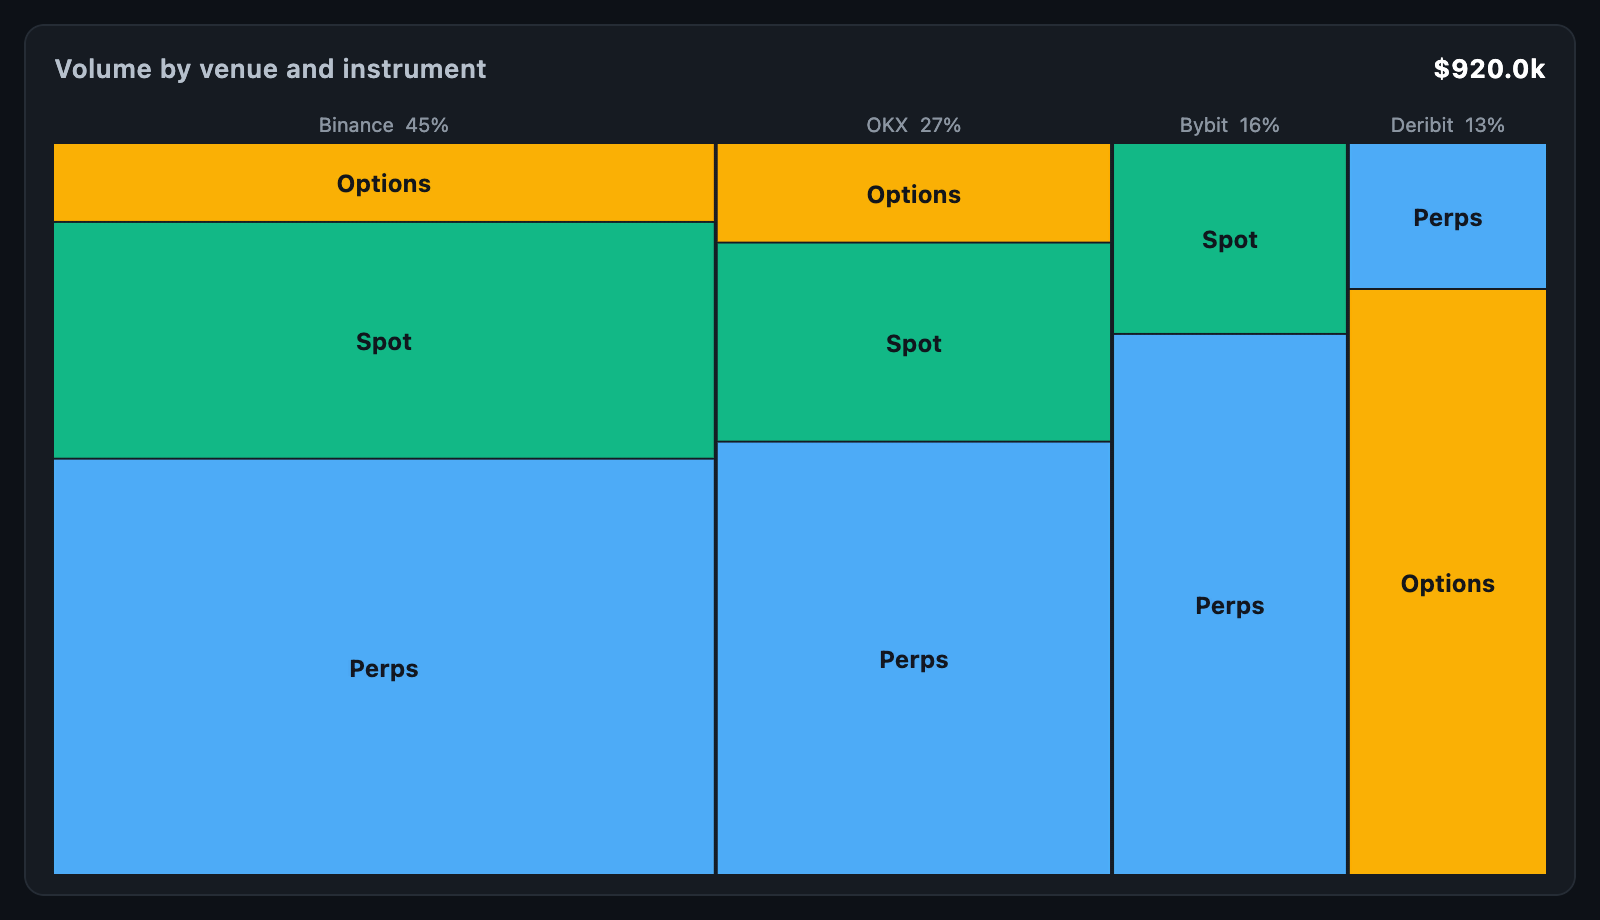 Marimekko Two dimensions at once: column width and cell height. |
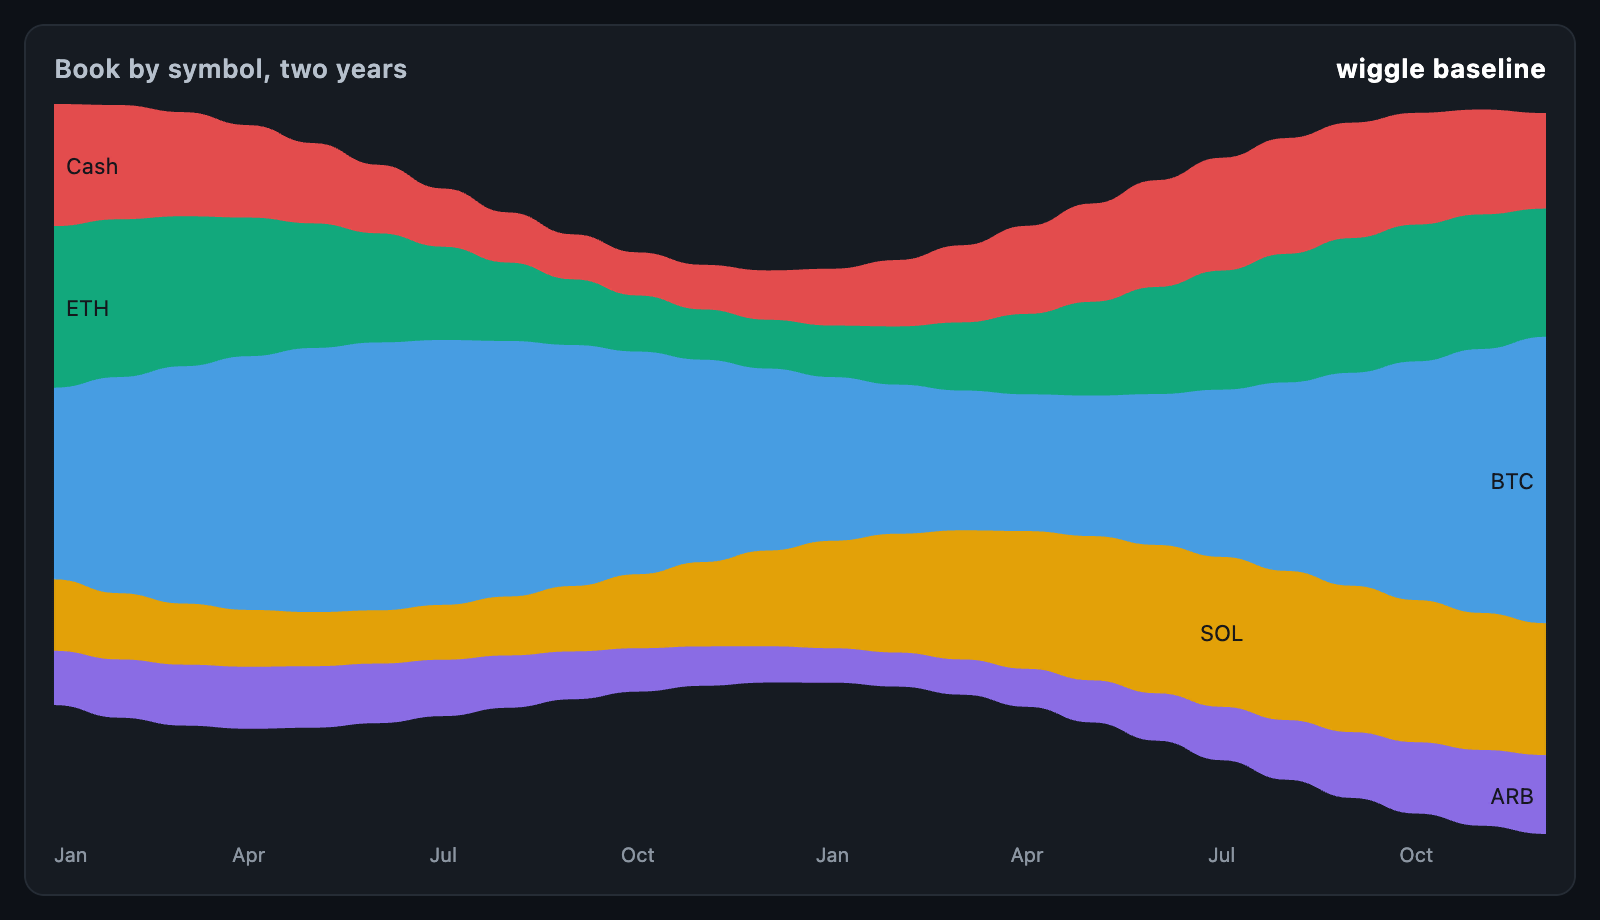 Stream graph Two years of composition, on a wiggle baseline. |
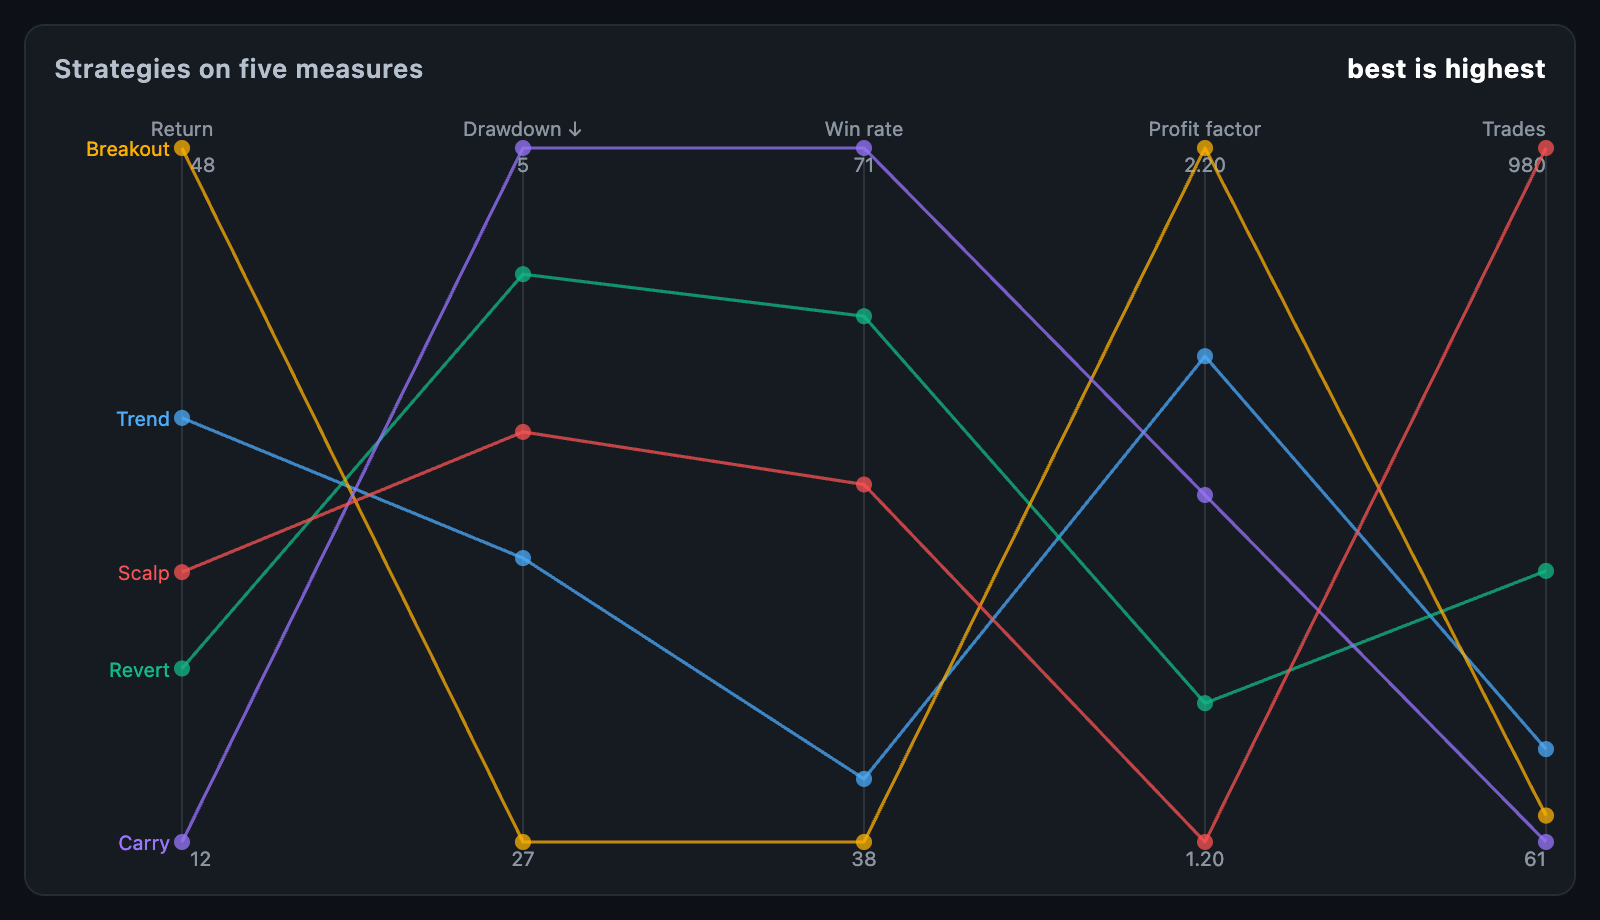 Parallel coordinates Five strategies compared on five measures at once. |
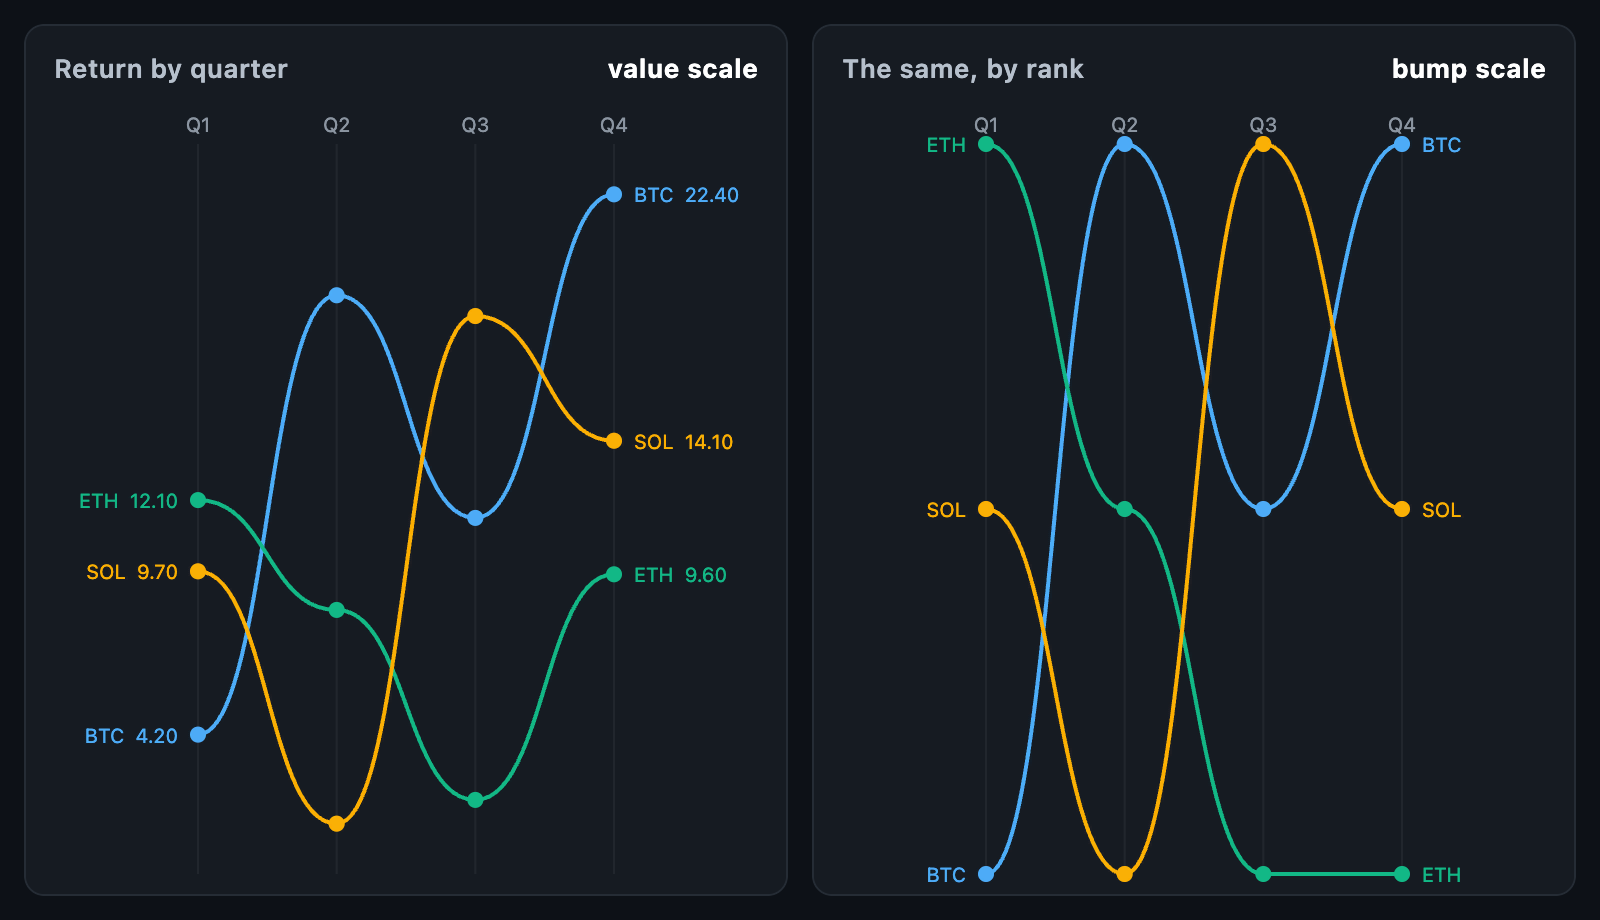 Slope and bump Returns by quarter, by value and by changing rank. |
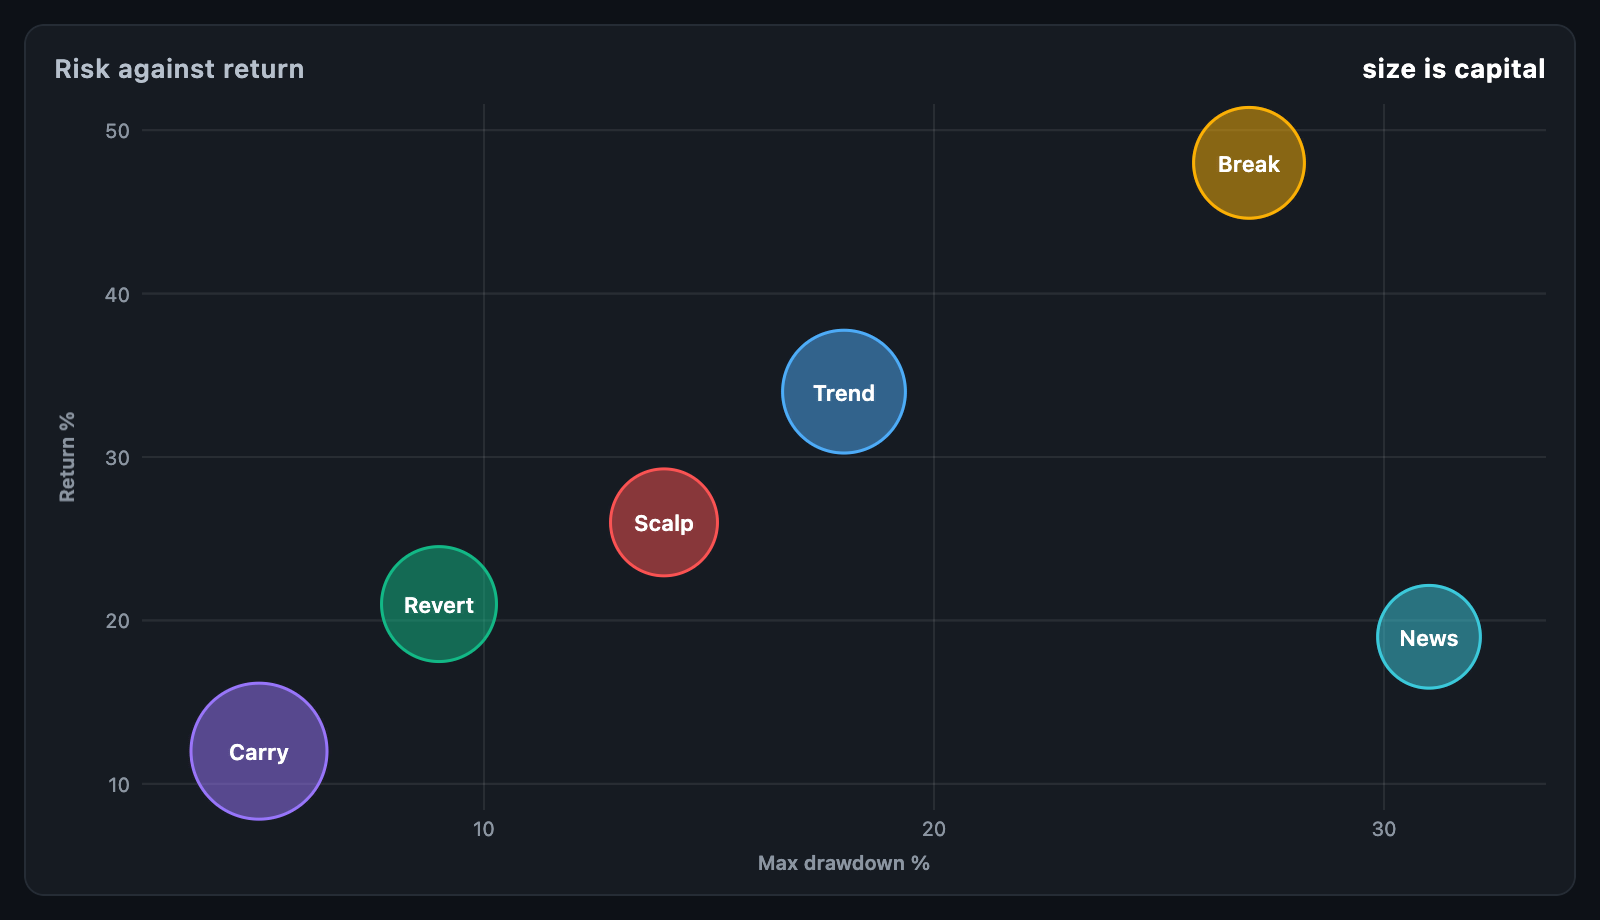 Bubble Risk against return, sized by capital. |
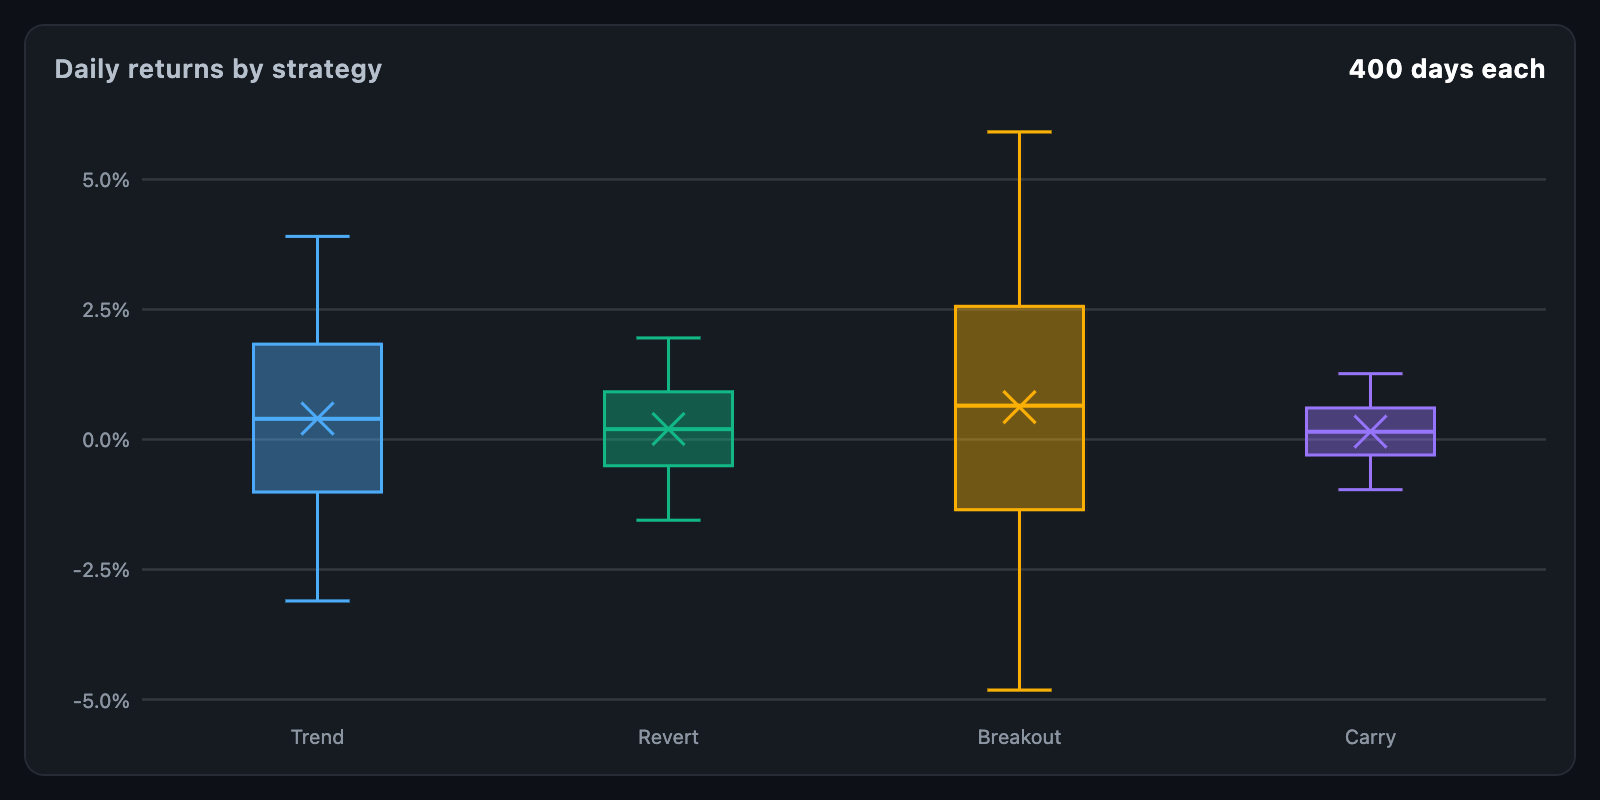 Box plot Quartiles, whiskers and outliers for four strategies. |
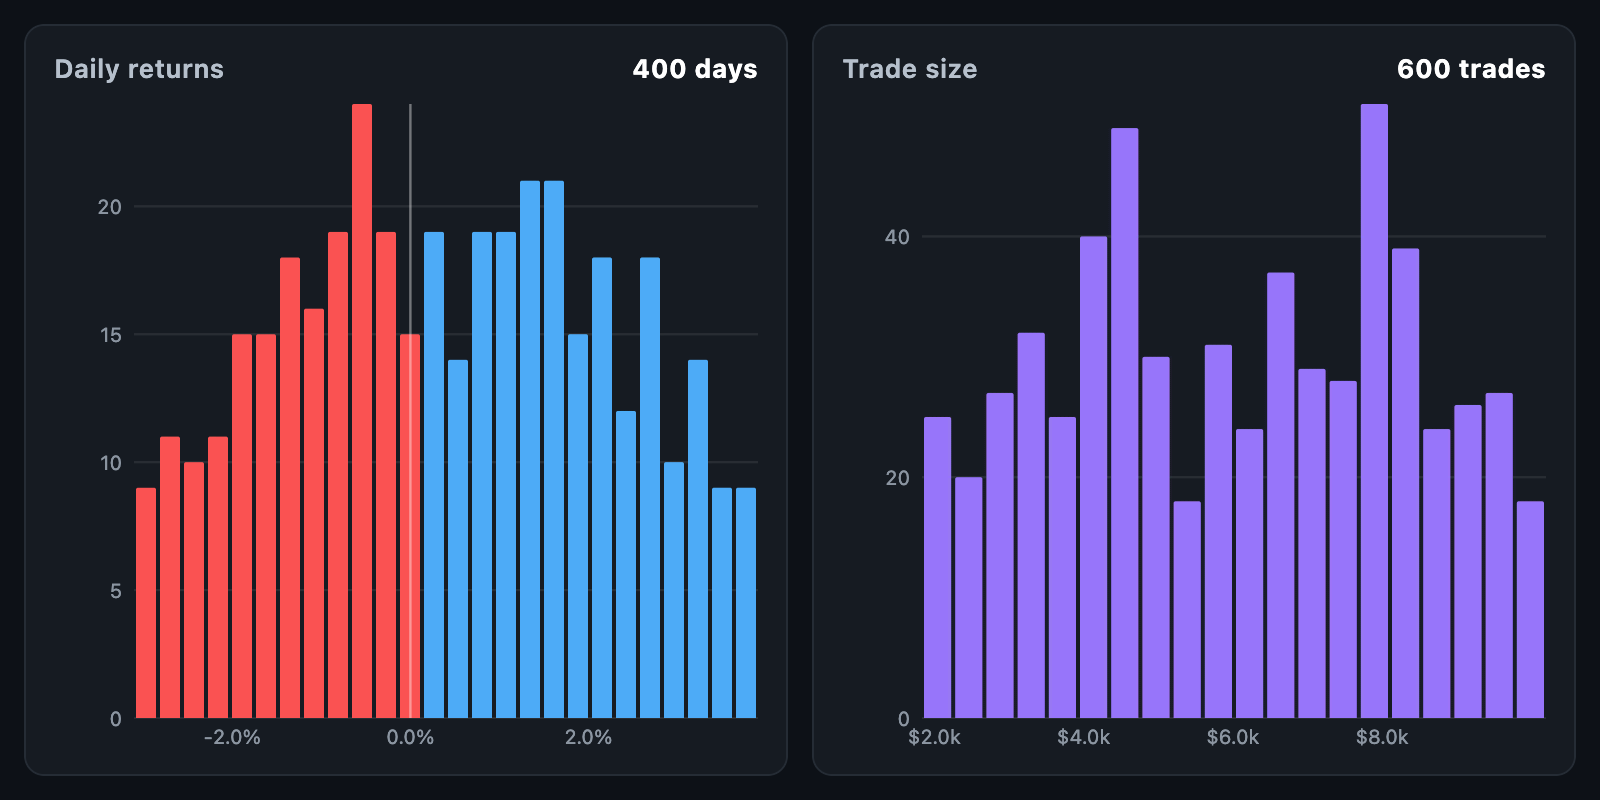 Histogram Daily returns split at zero, and a spread of trade sizes. |
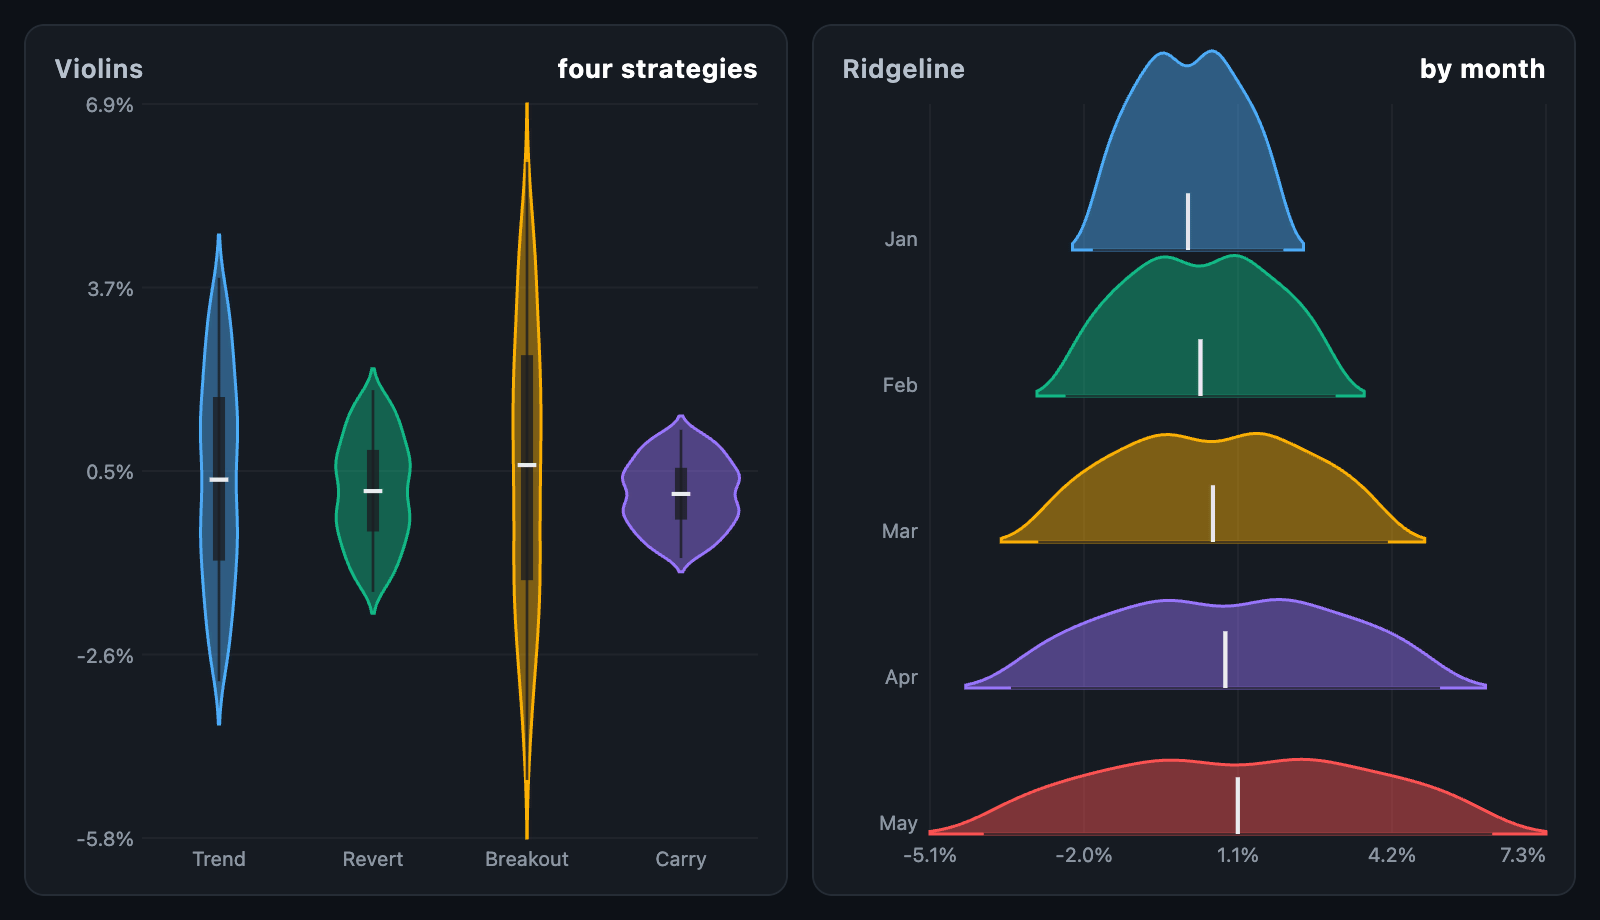 Violin and ridgeline The shape of a distribution, side by side or stacked. |
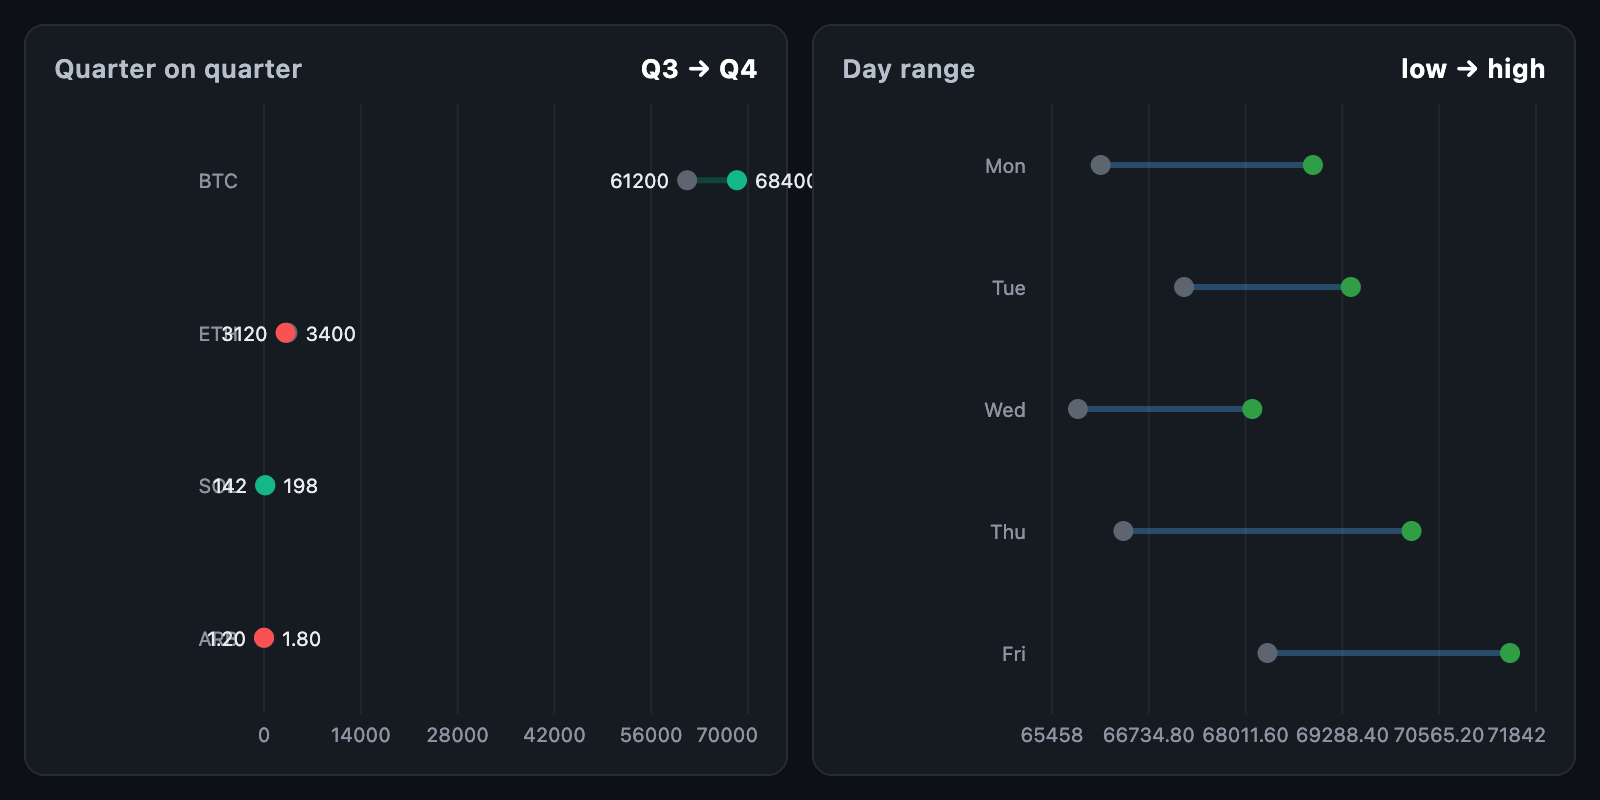 Dumbbell Two values a row, joined by a bar. |
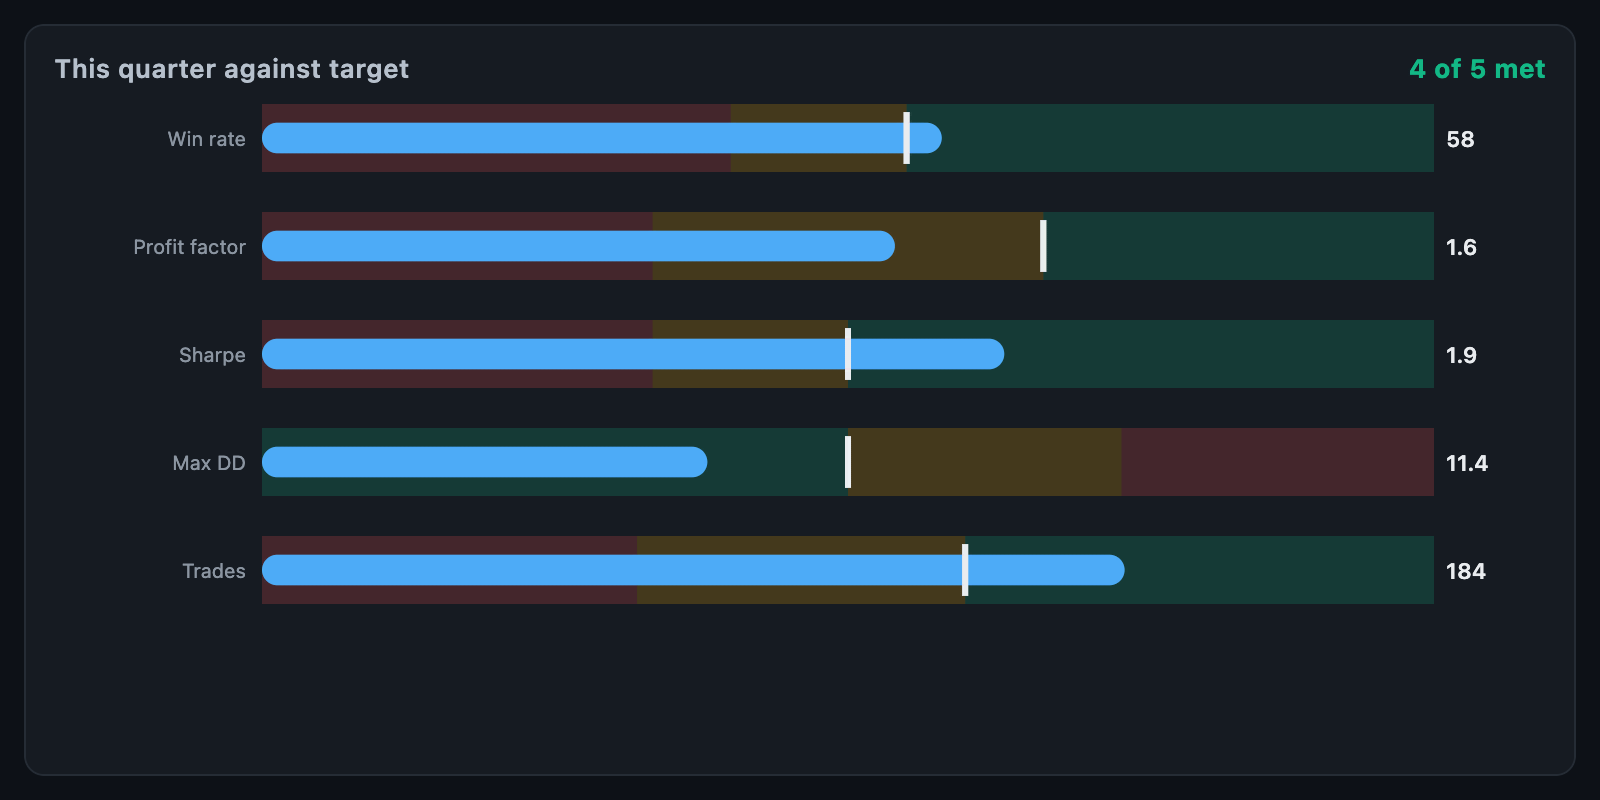 Bullet KPIs against their targets, on banded tracks. |
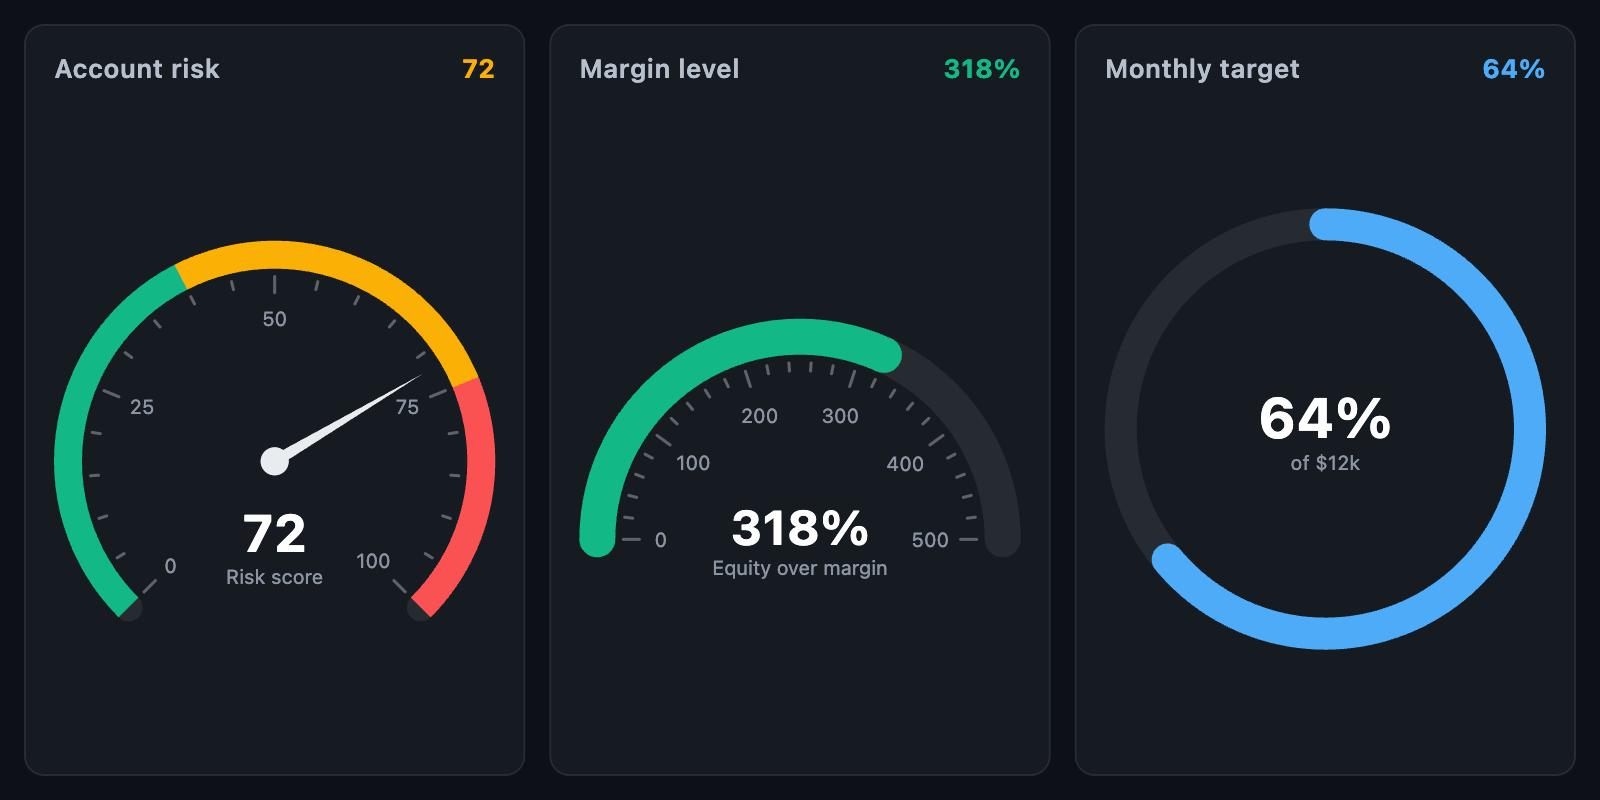 Gauge A dial with coloured ranges, a half circle and a progress ring. |
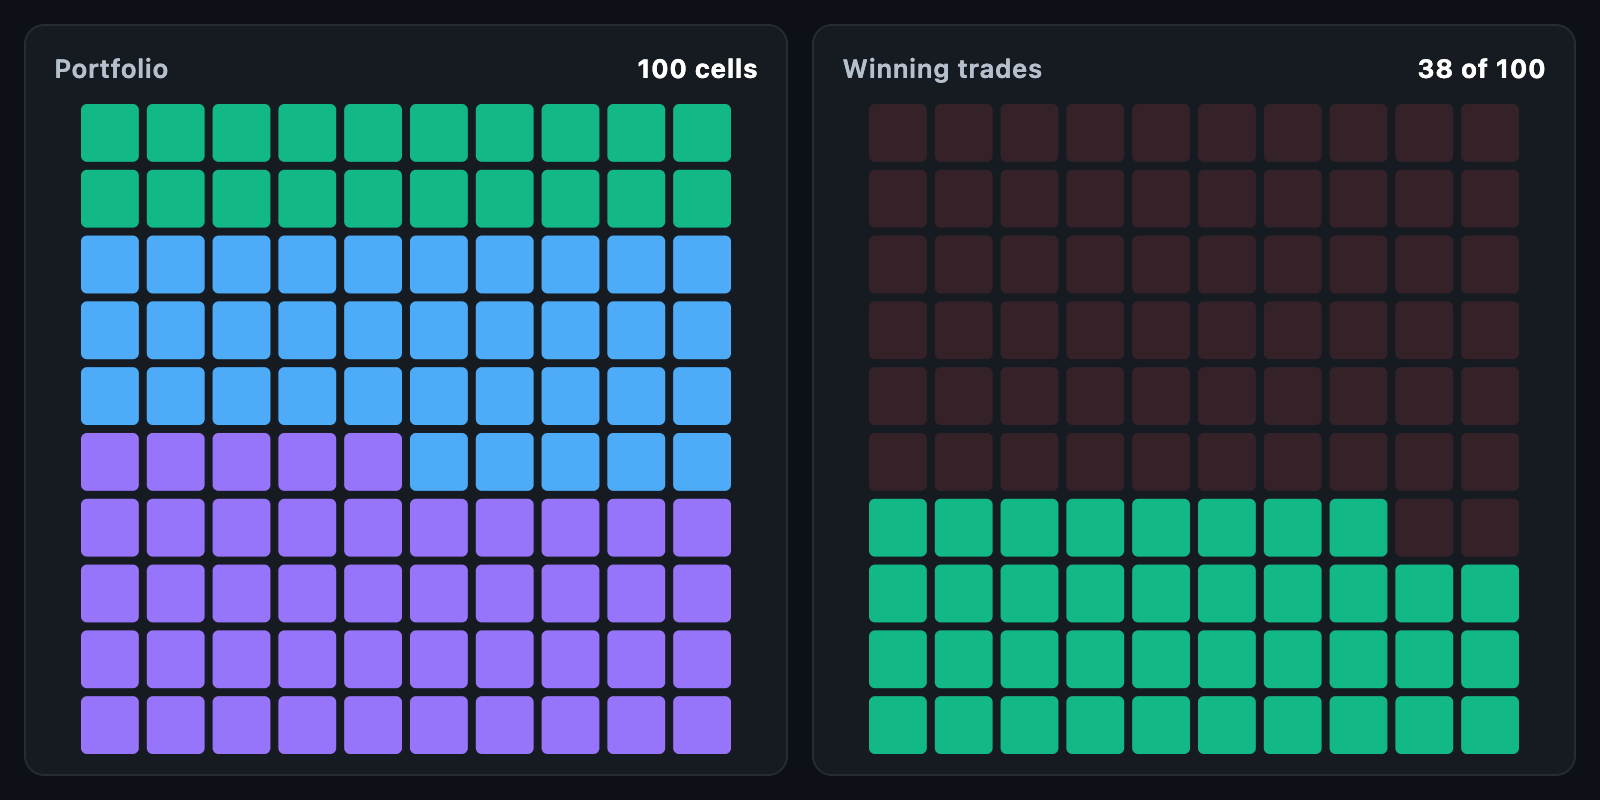 Waffle Shares as a hundred squares, counted rather than judged. |
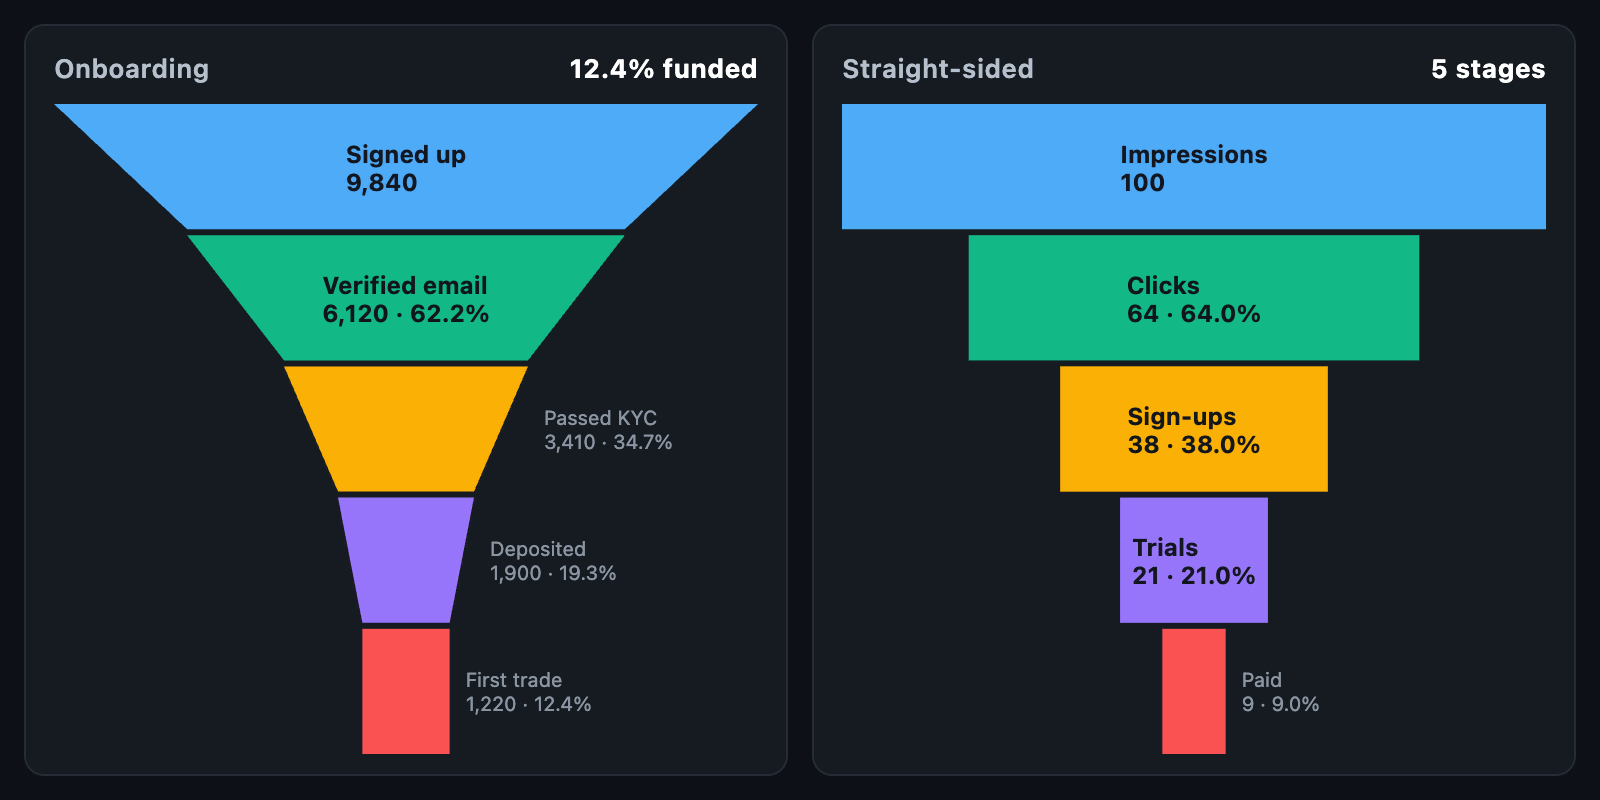 Funnel Where the people go, tapered or straight-sided. |
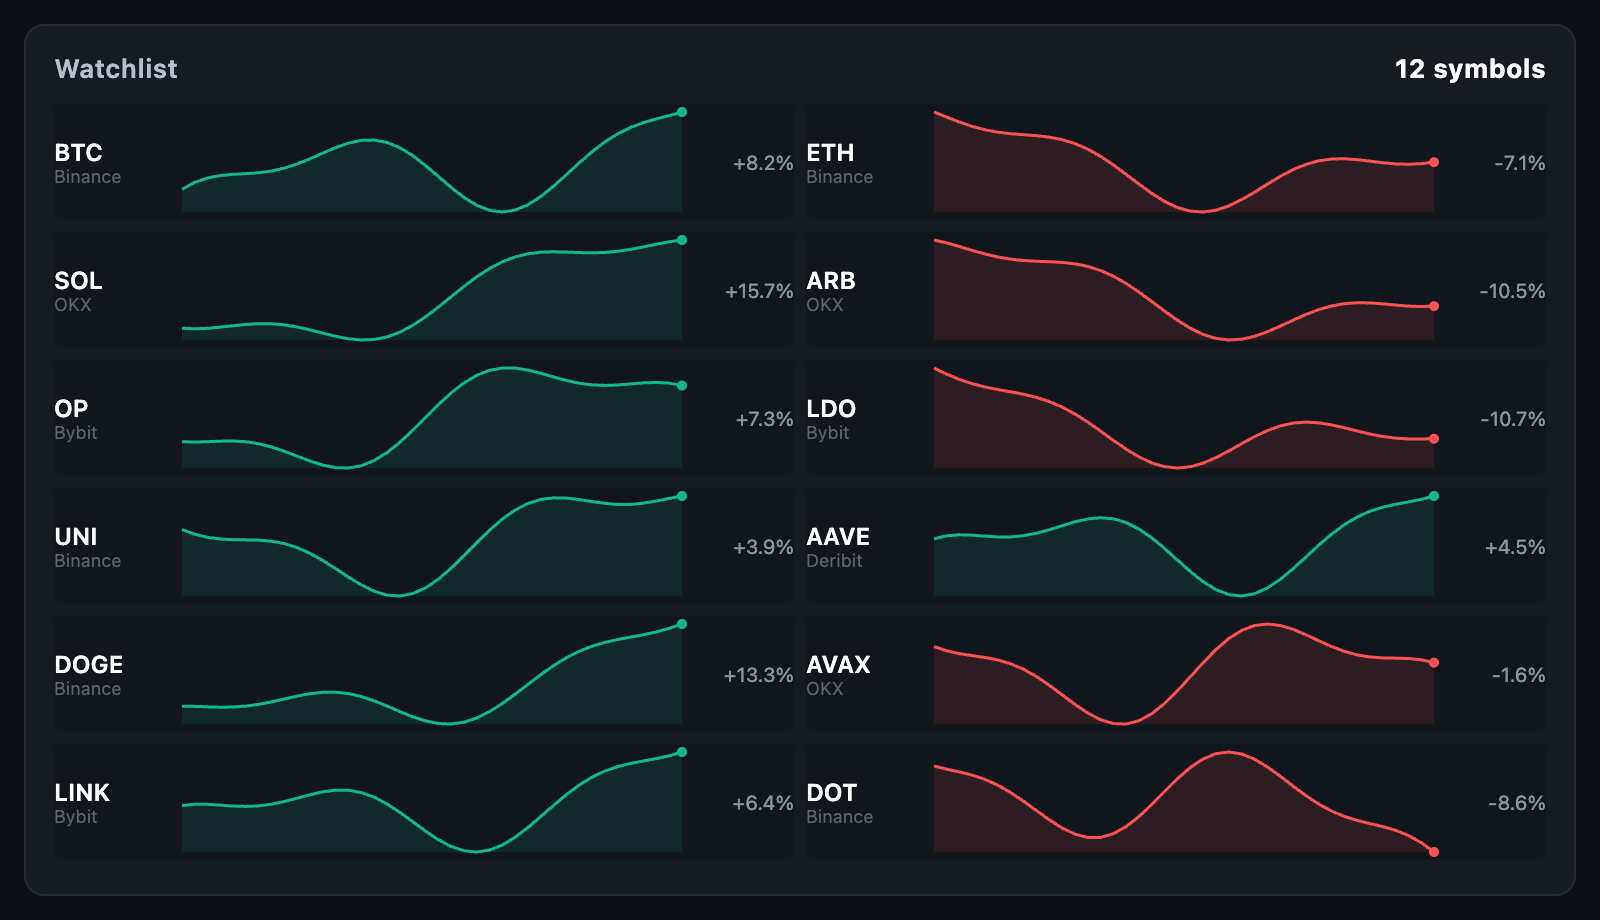 Sparkline grid A watchlist of small multiples, a name and a shape each. |
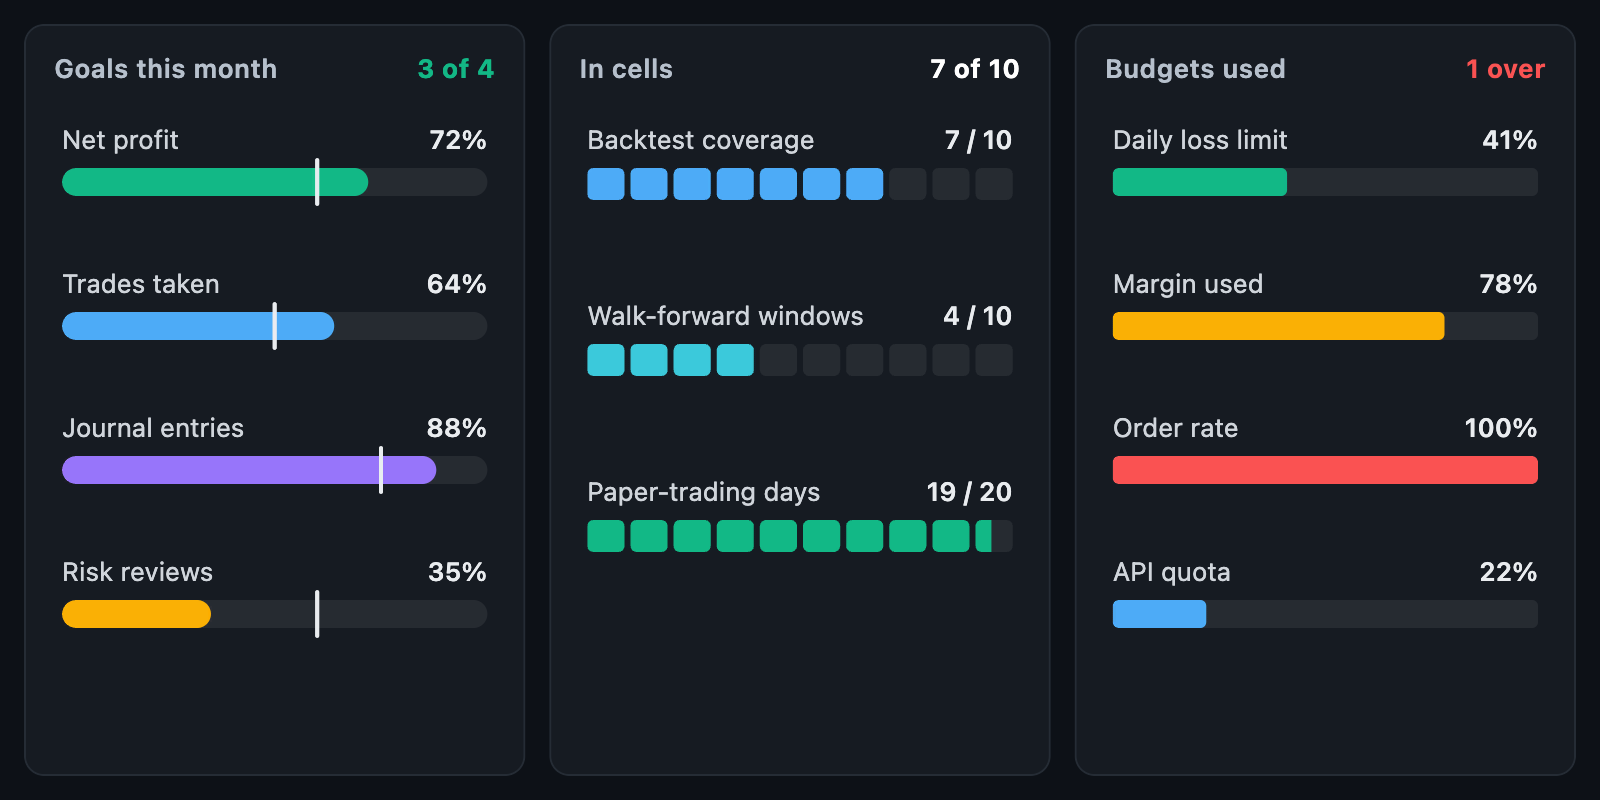 Progress bars Goals as pills, blocks or cells, with a mark for where each should be. |
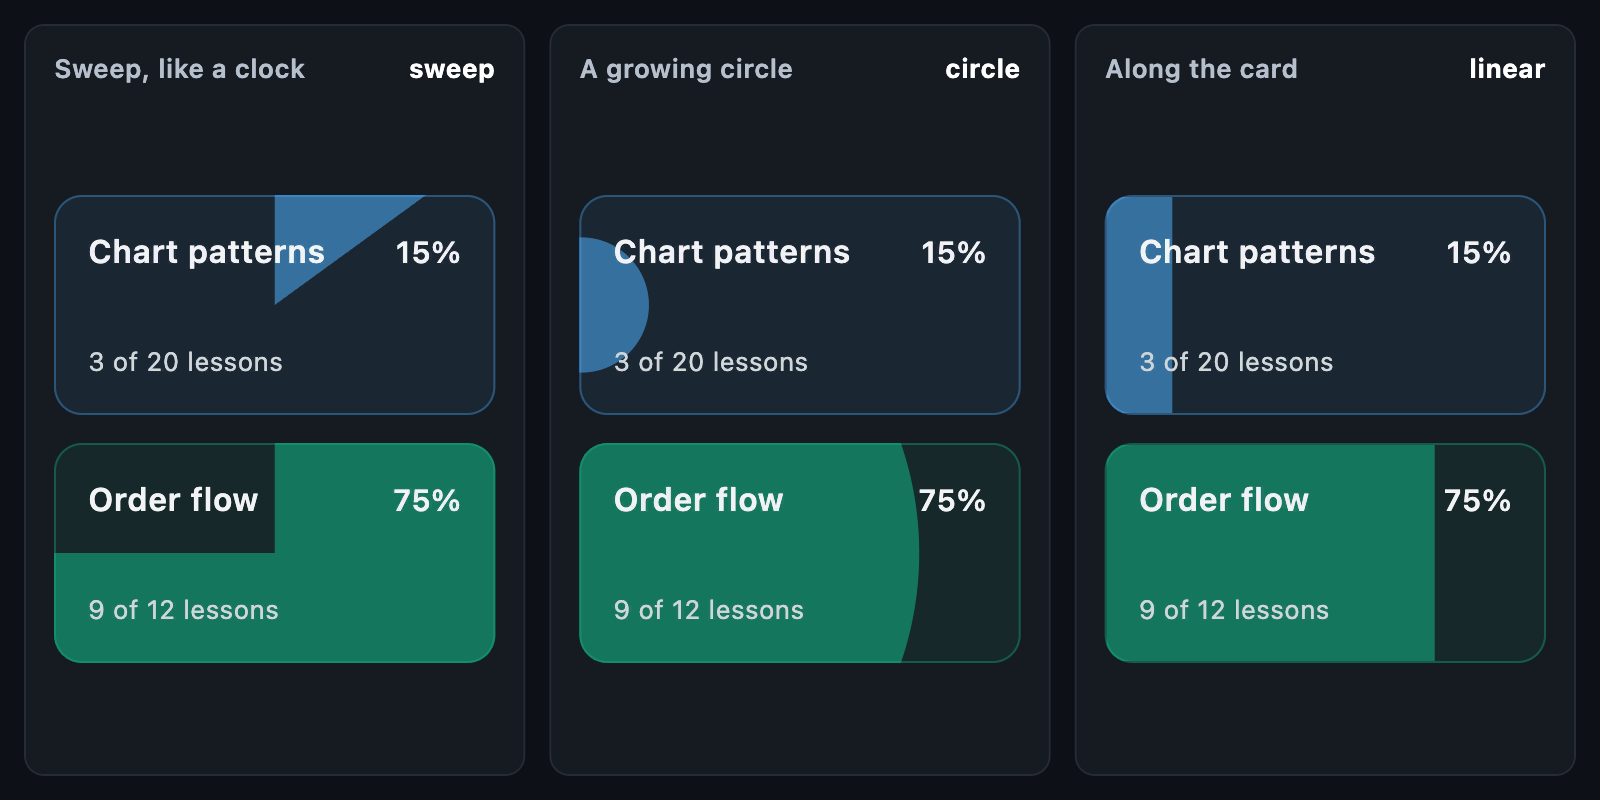 Progress card Course cards whose whole background is the progress: a sweep, a growing circle or a bar. |
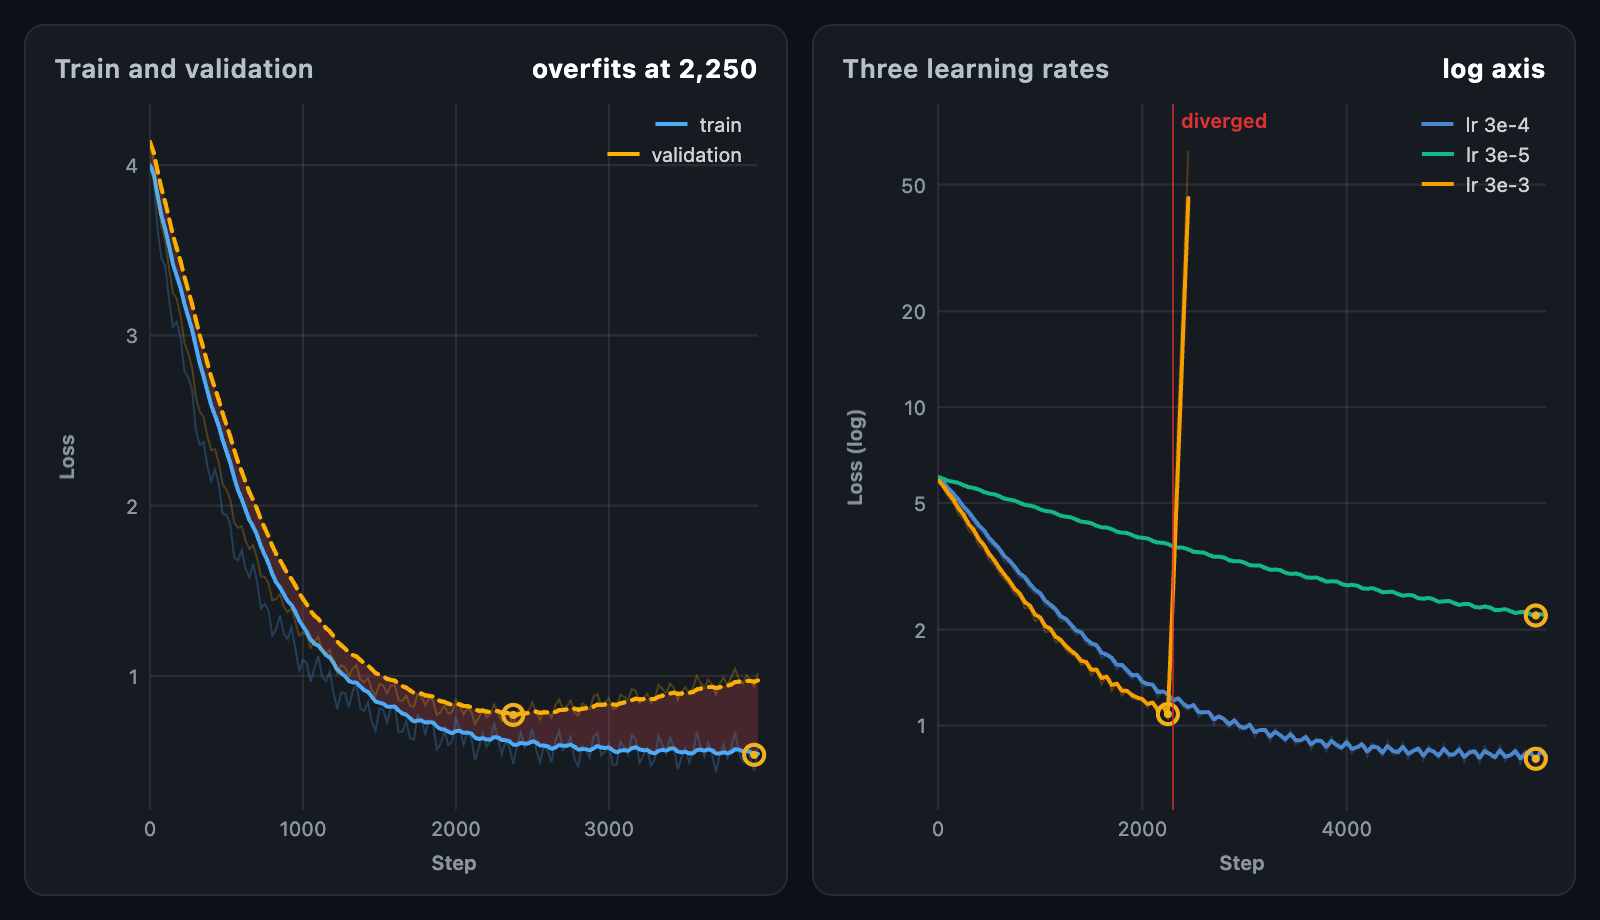 Training curves Loss and accuracy of runs, smoothed, with the best checkpoint and divergence marked. |
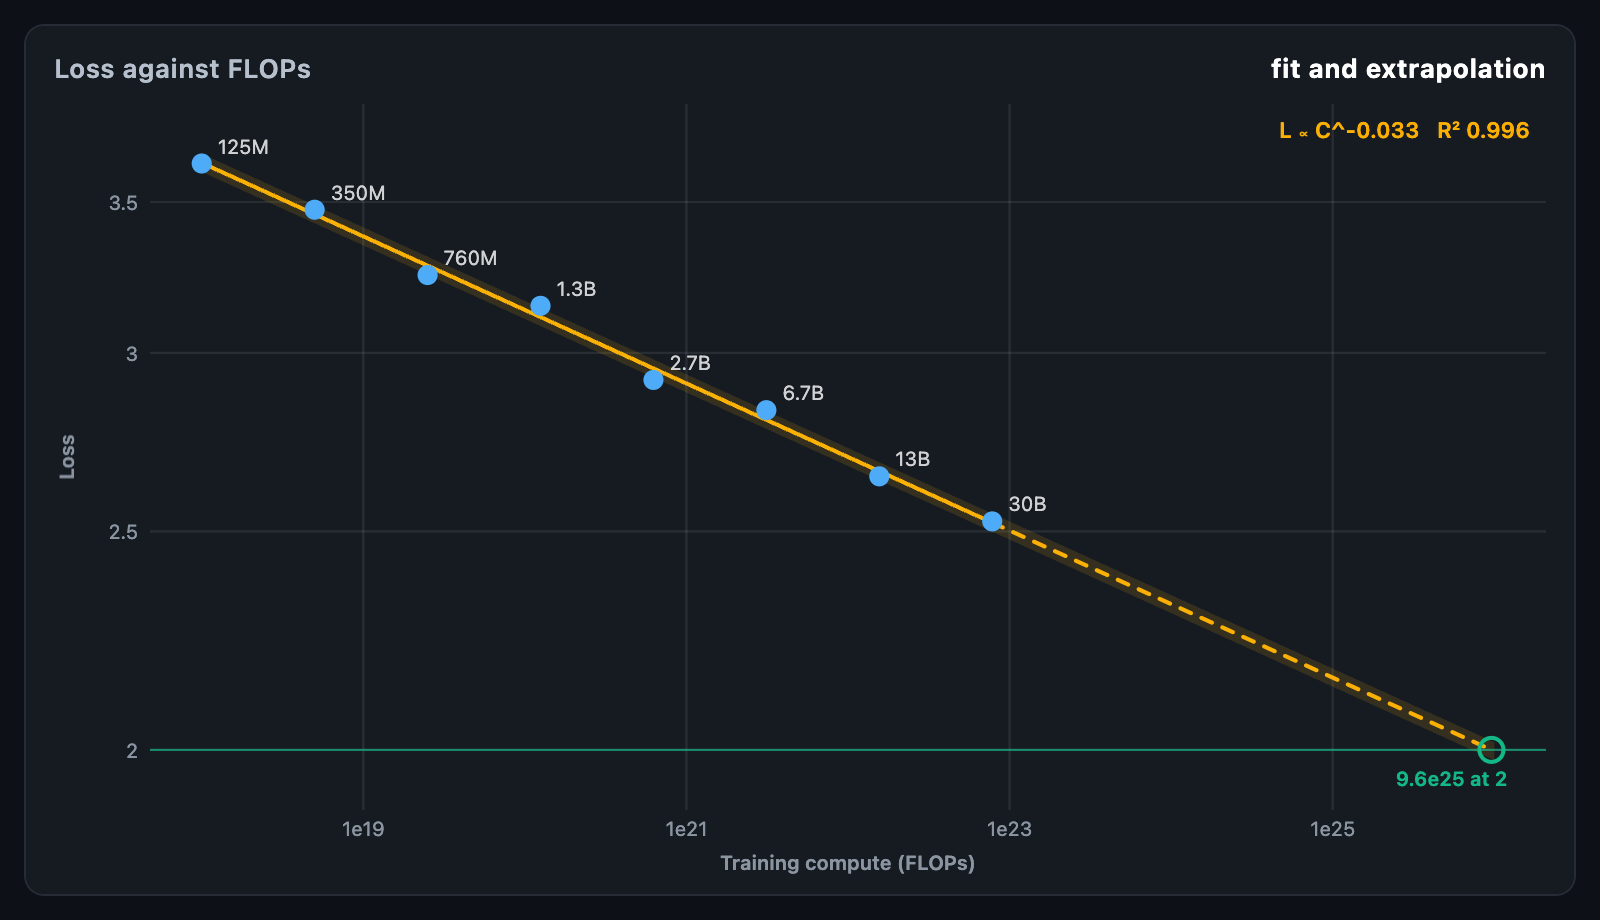 Scaling laws Loss against compute on log-log axes, with the power law fitted and extrapolated. |
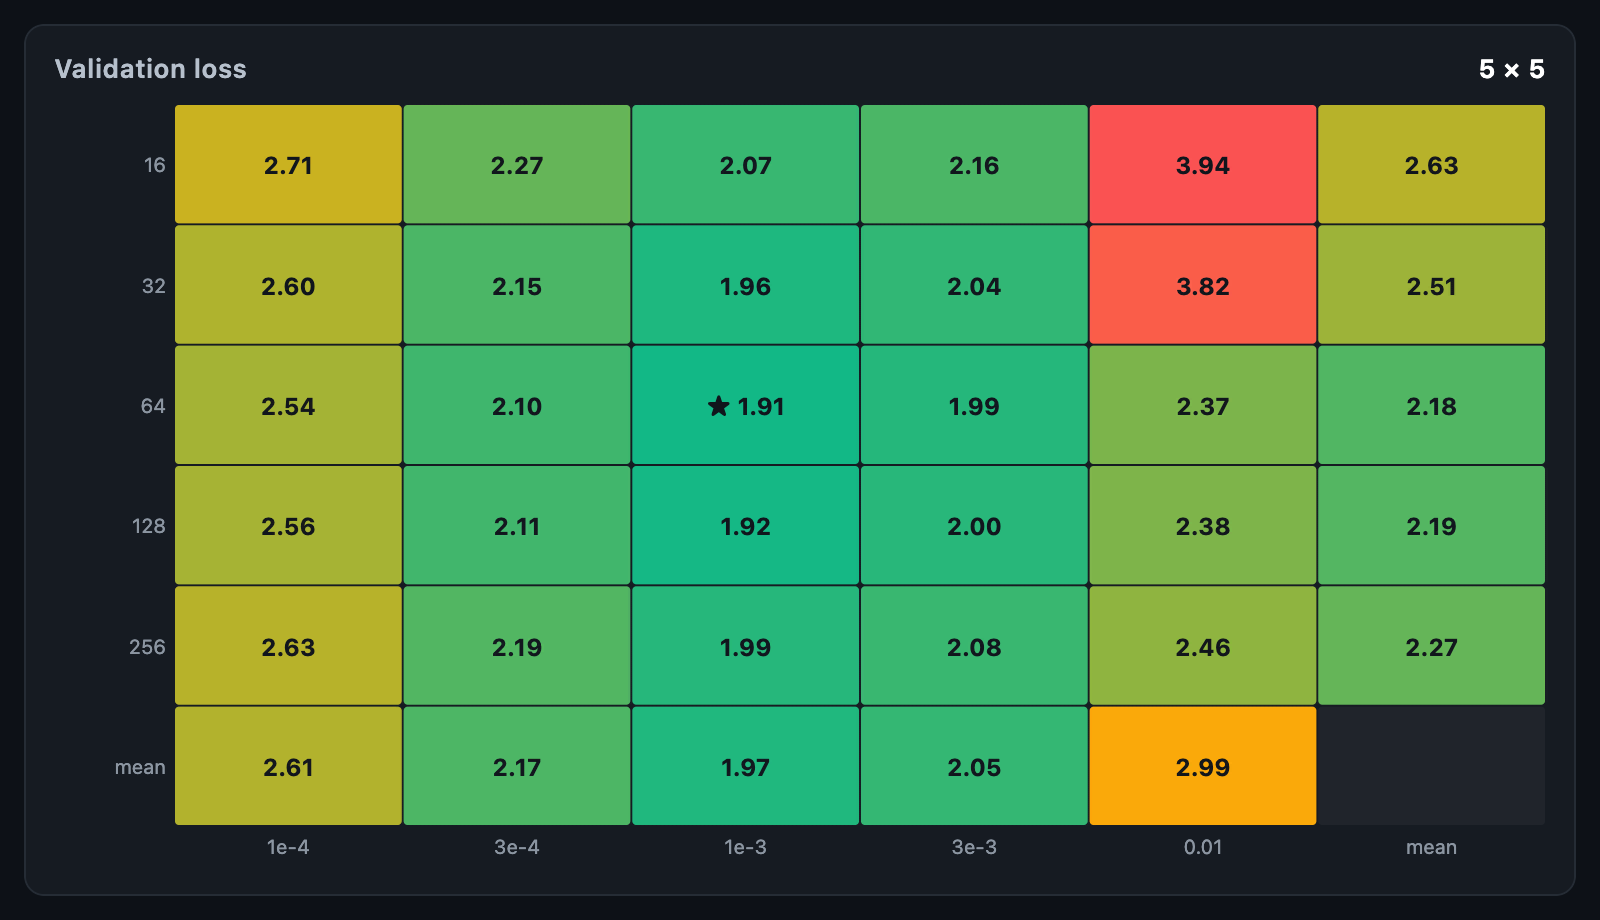 Hyperparameter sweep A learning-rate by batch-size grid, the best combination starred. |
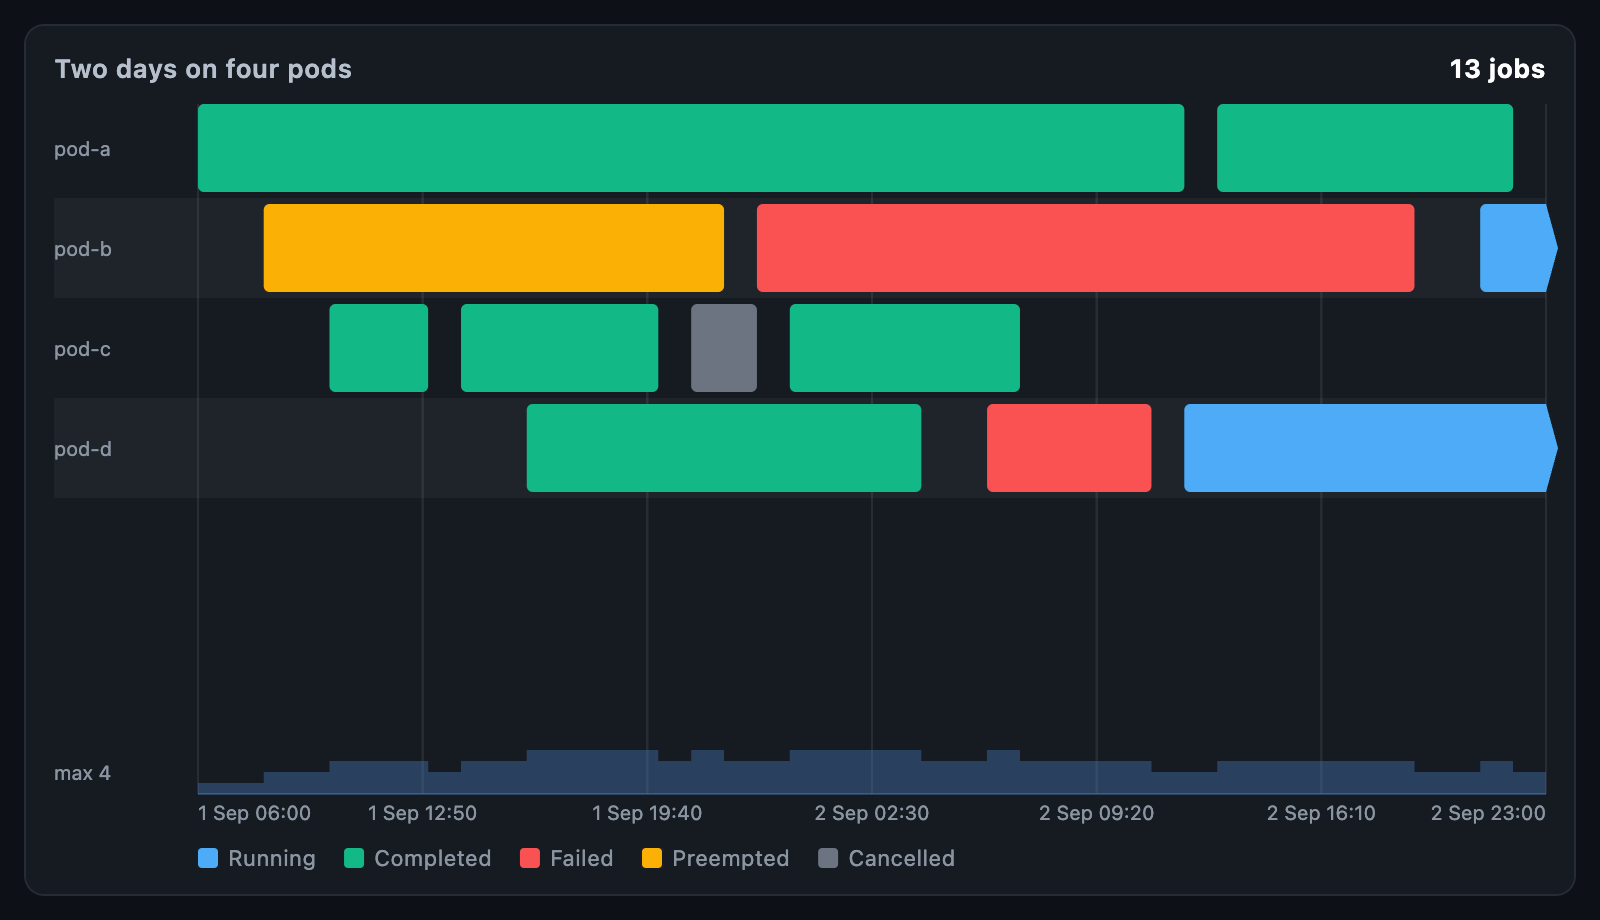 Training timeline Jobs by machine, coloured by how each finished. |
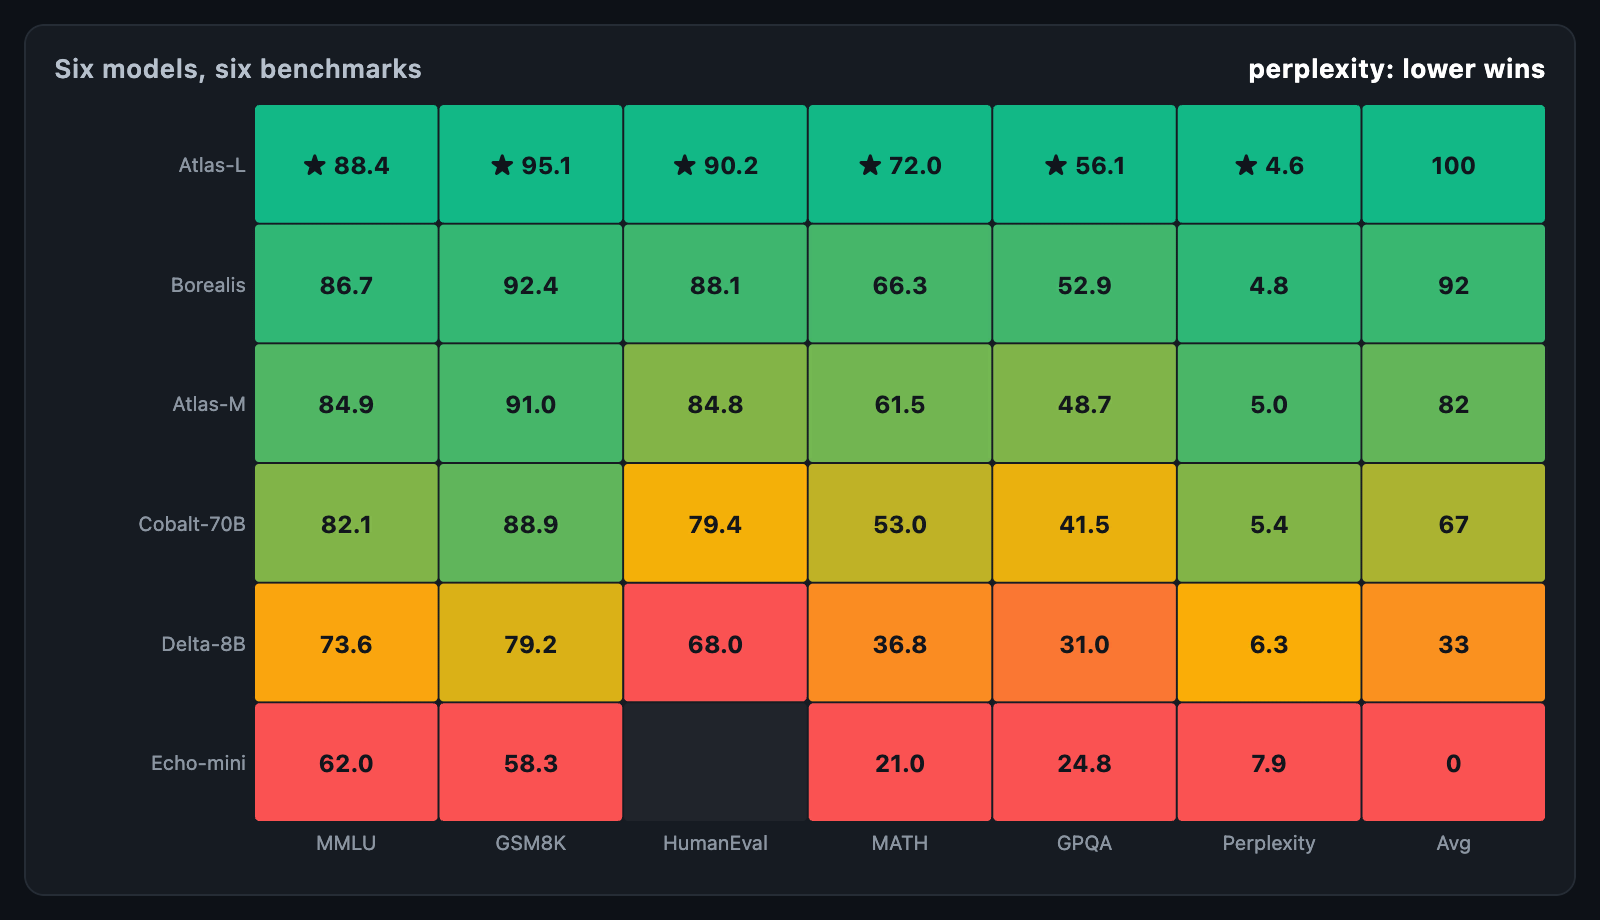 Benchmark matrix Models against benchmarks, coloured by standing, leaders starred. |
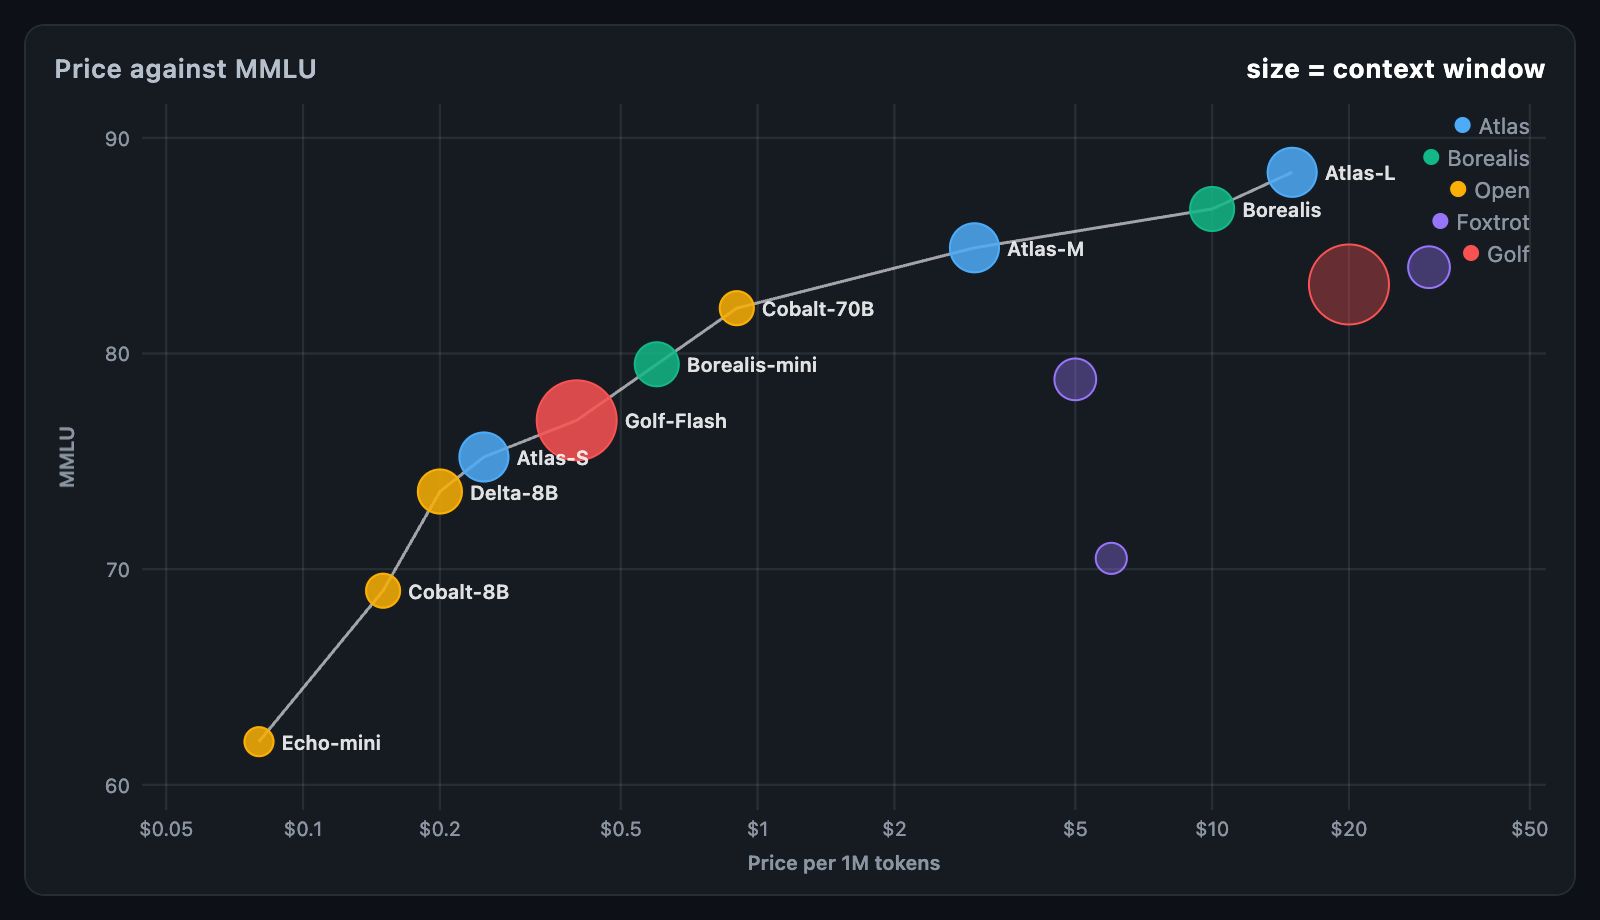 Model cost against quality Models by price and score, with the Pareto frontier. |
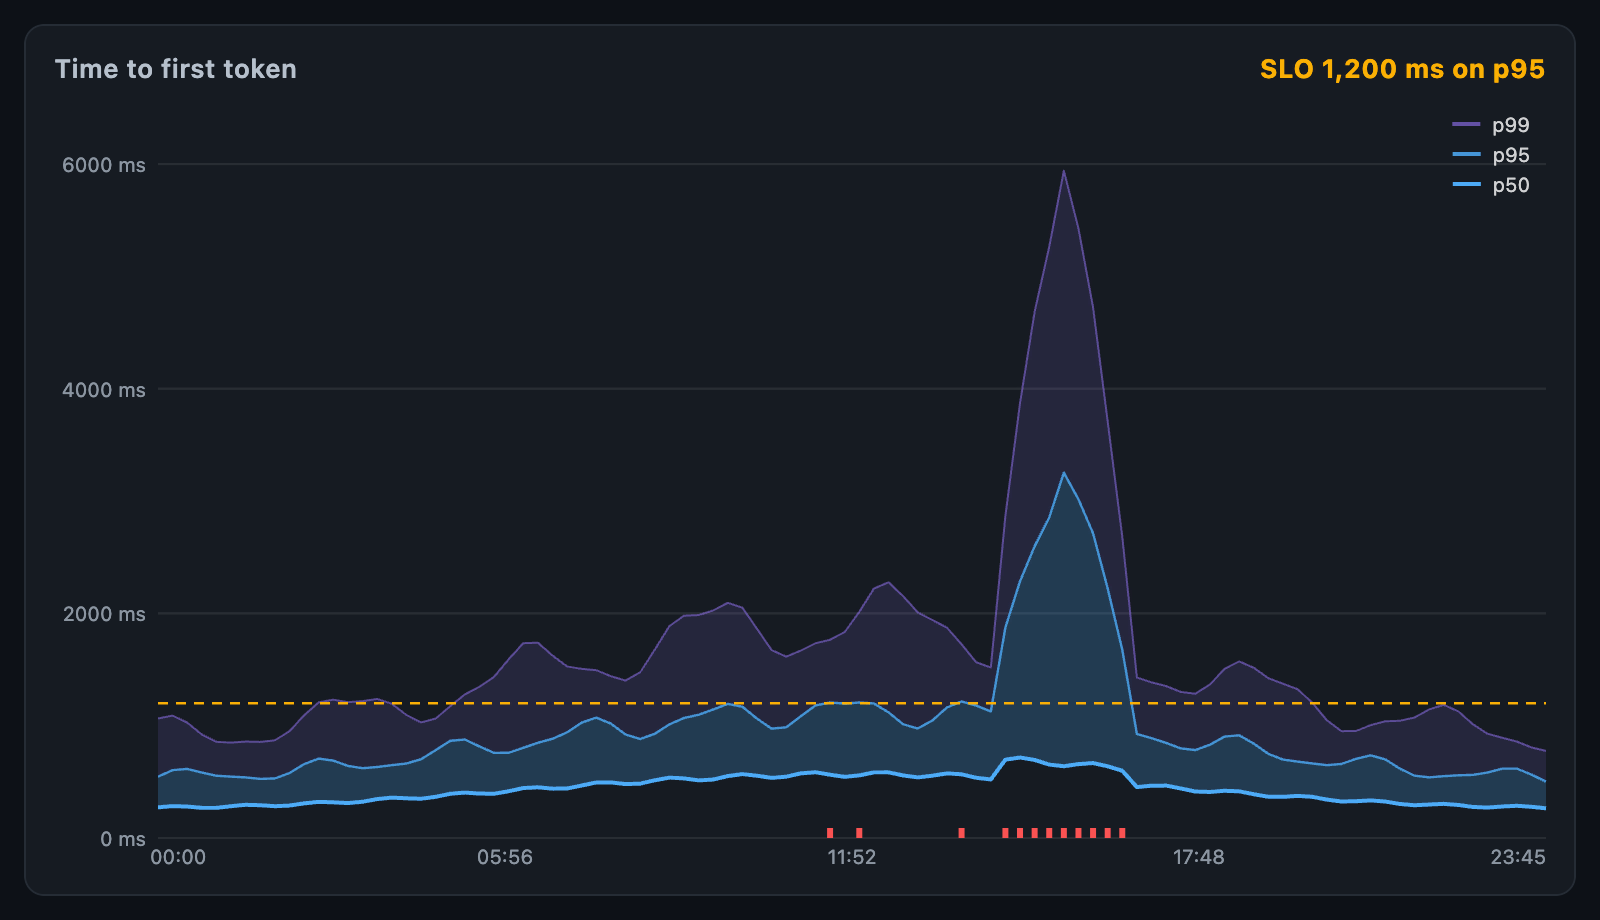 Latency bands p50, p95 and p99 over a day, with an objective and its breaches. |
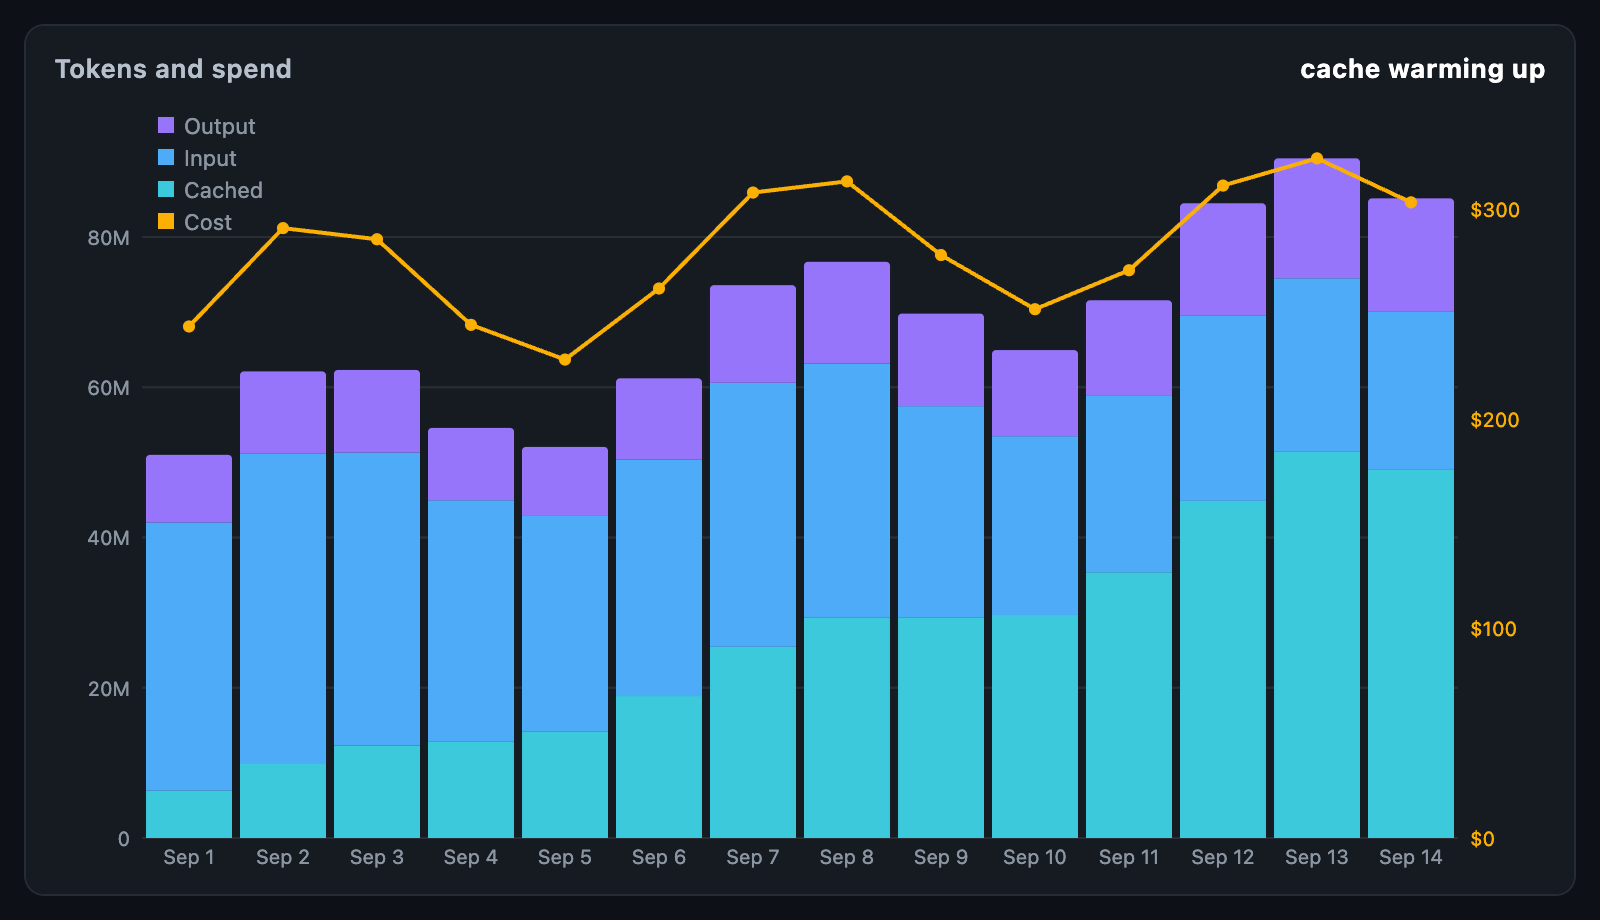 Token usage Cached, input and output tokens, with the cost as a line. |
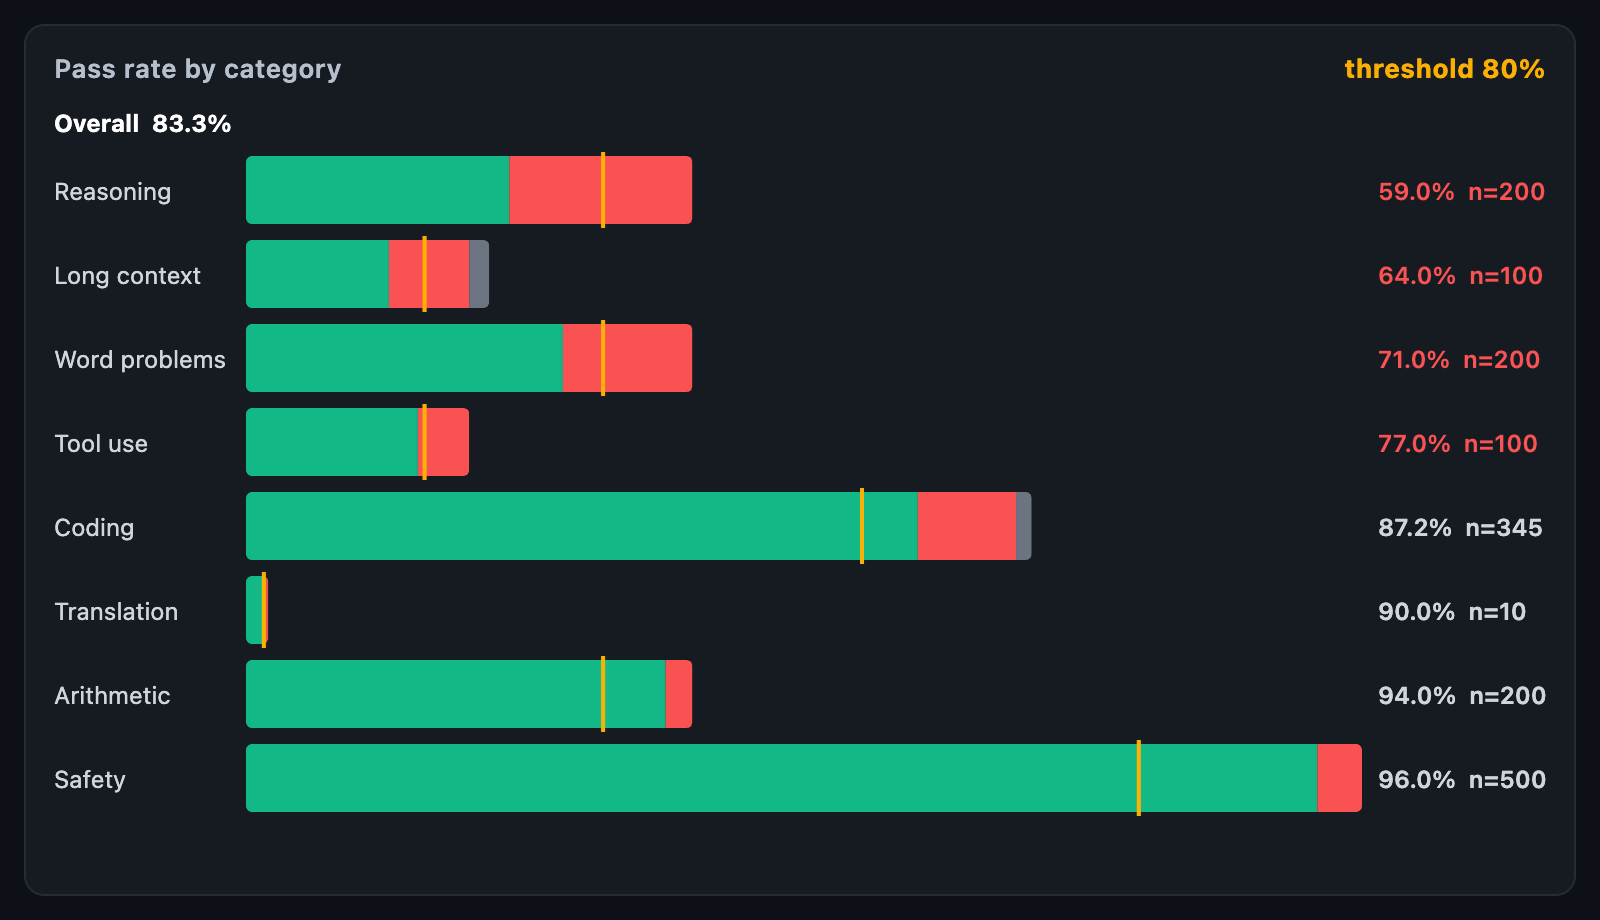 Evaluation breakdown Pass rate by category, worst first, with a threshold. |
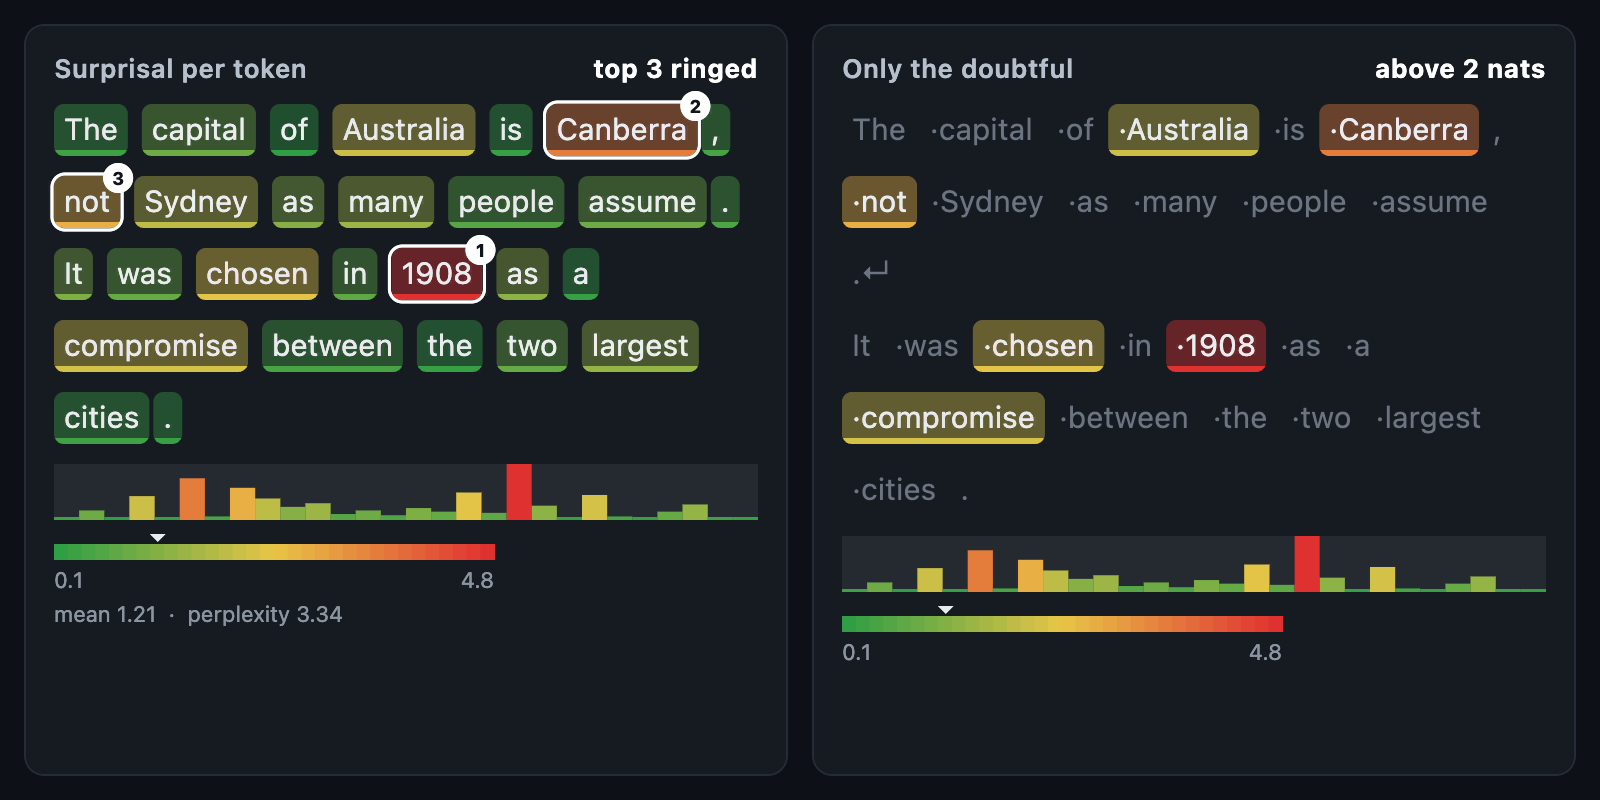 Token heatmap A completion with each token shaded by its surprisal. |
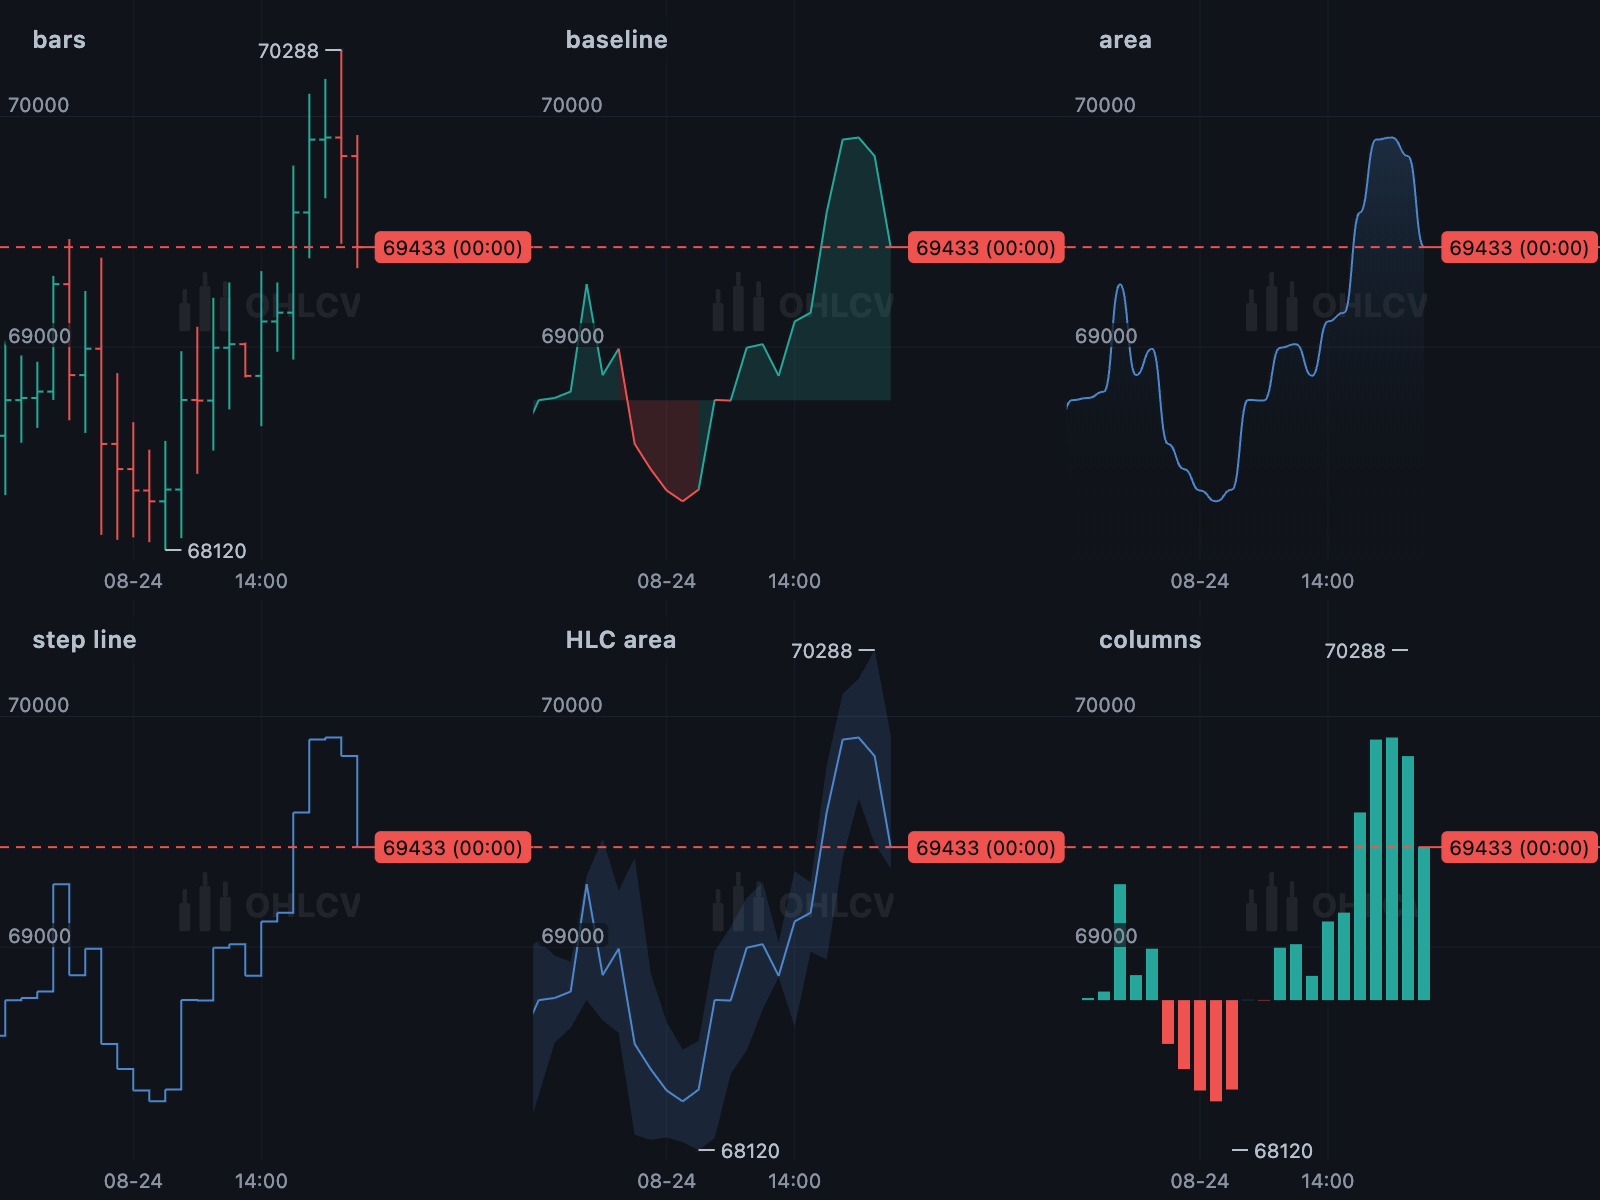 Eight chart types OHLC bars, baseline, area, step line, HLC area and columns. |
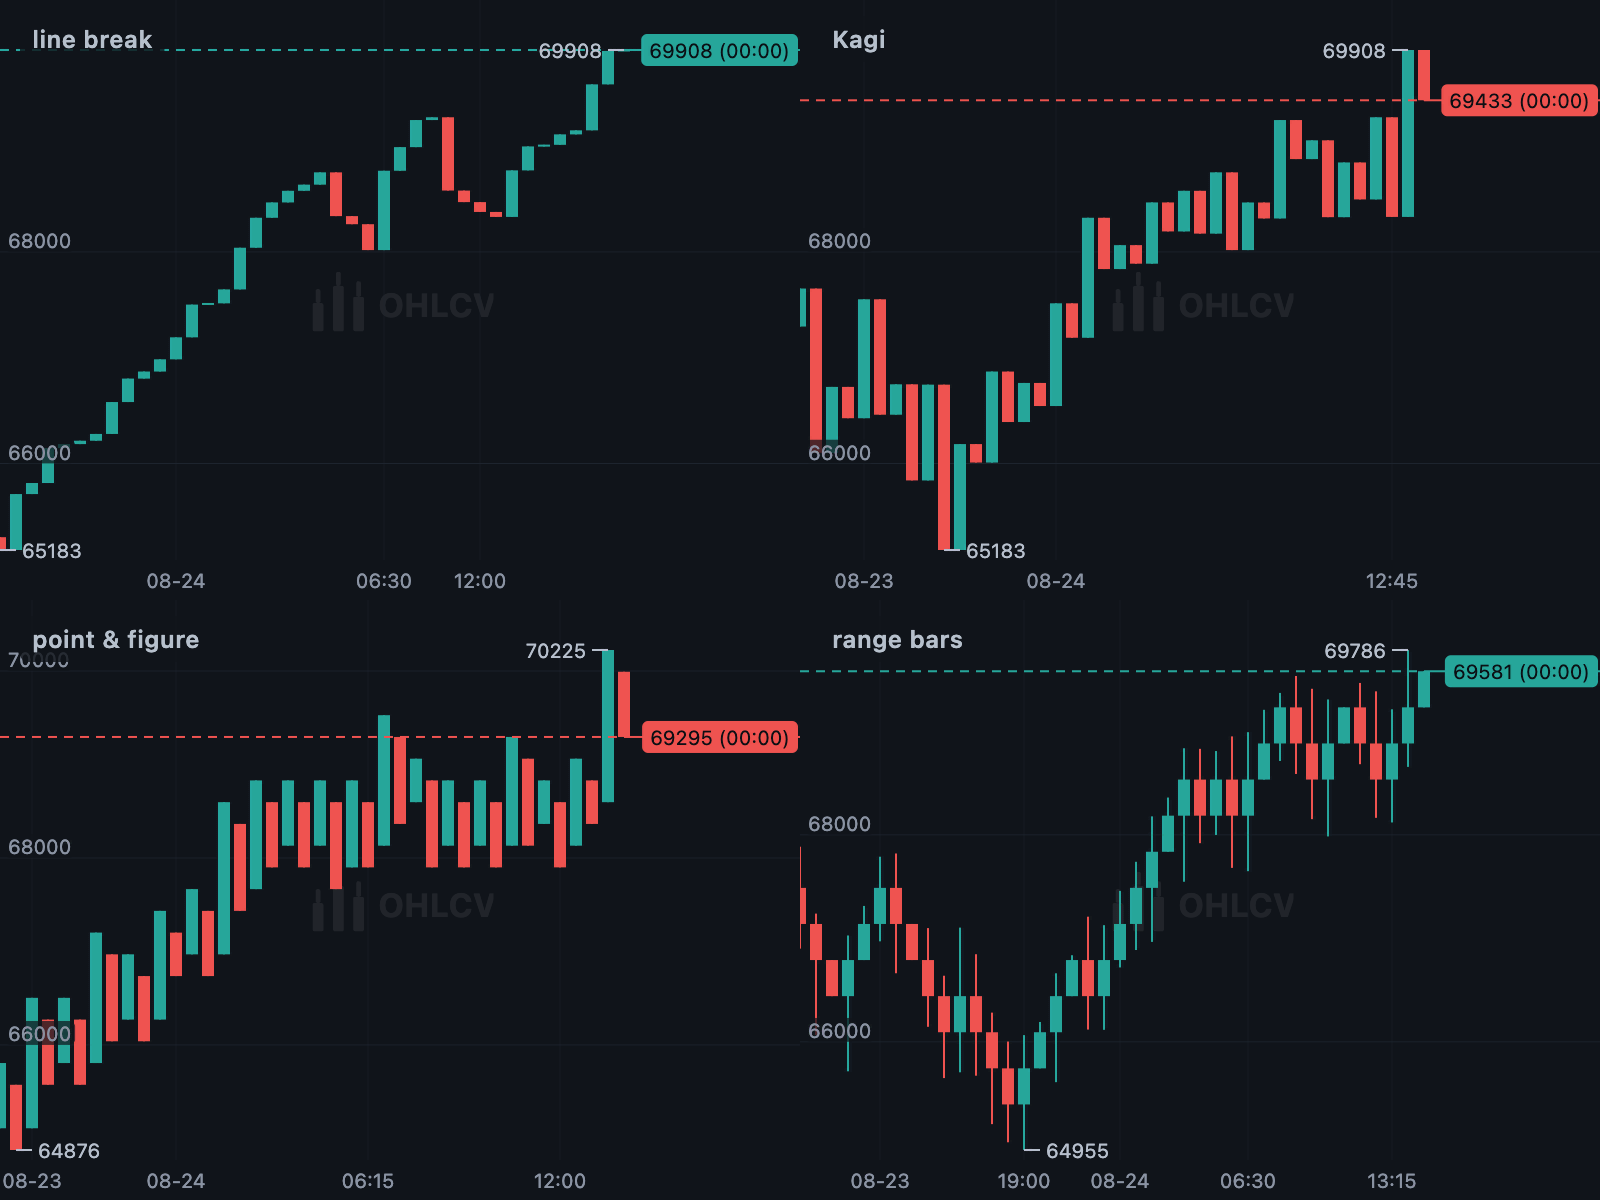 Four bar transforms Line break, Kagi, point & figure and range bars. |
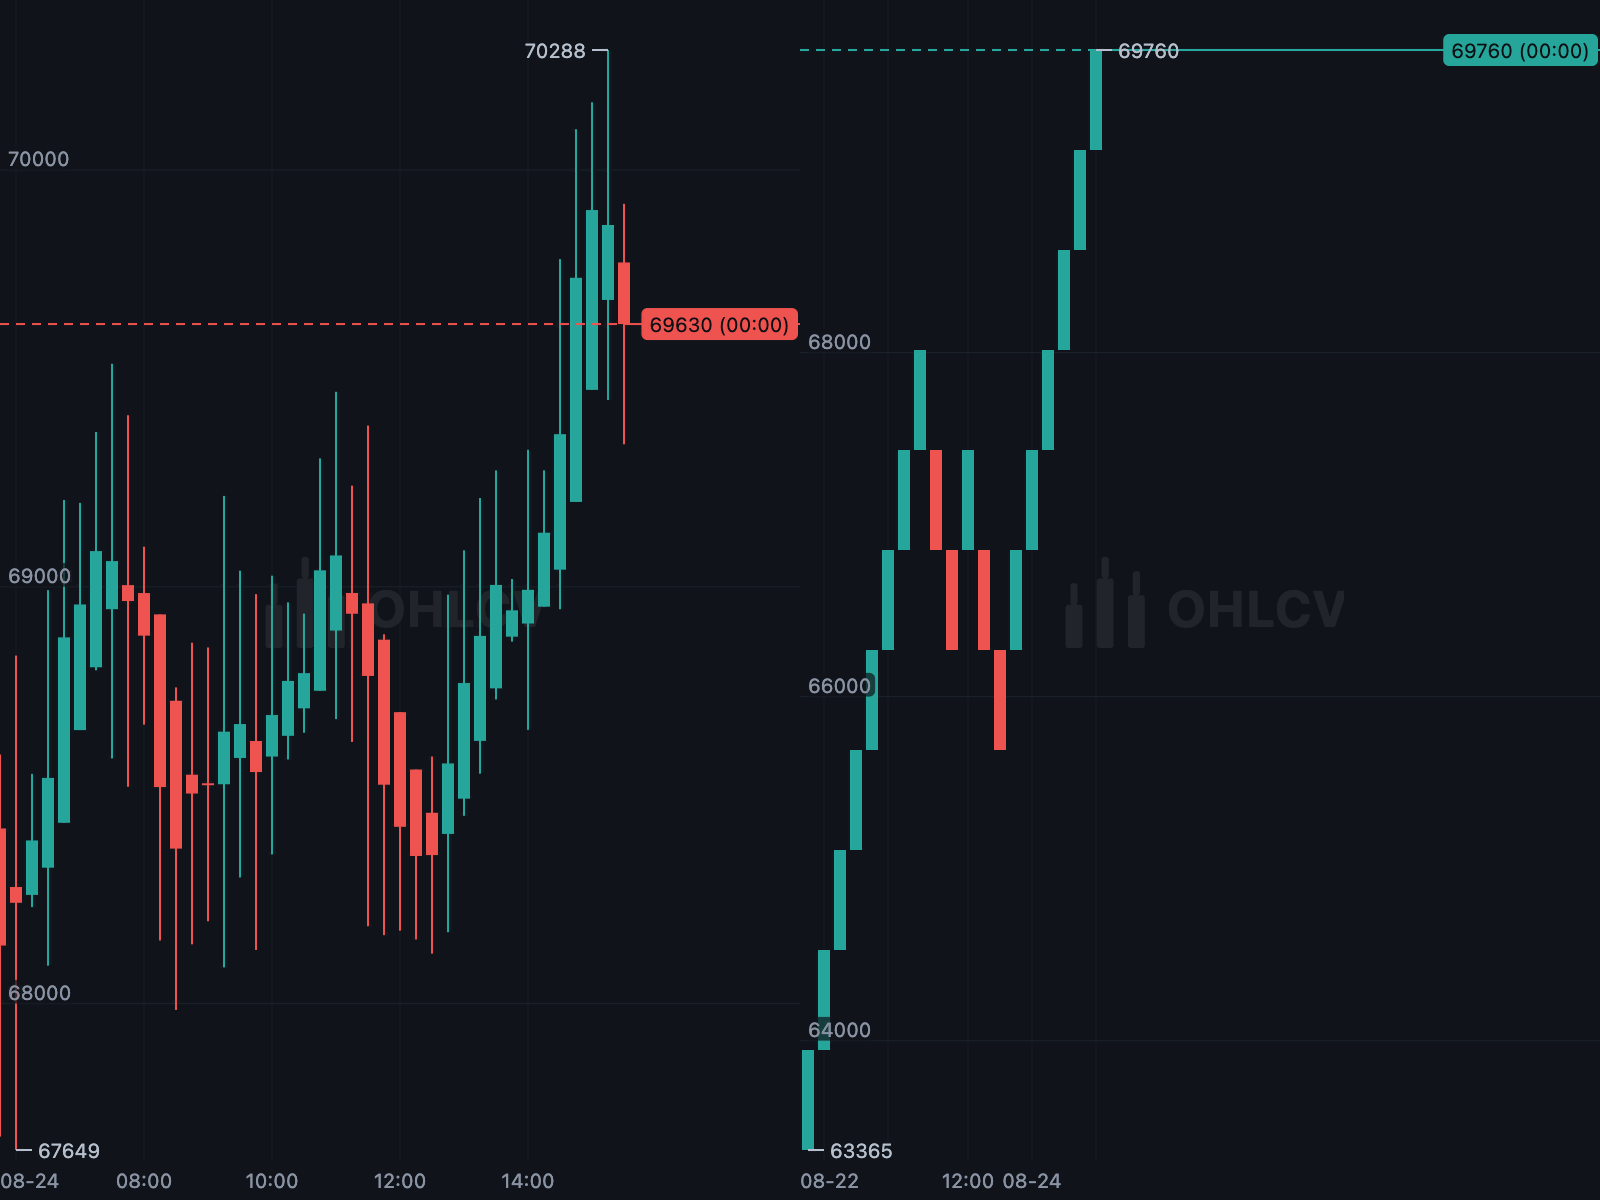 Heikin-Ashi and Renko Candles re-aggregated before rendering. |
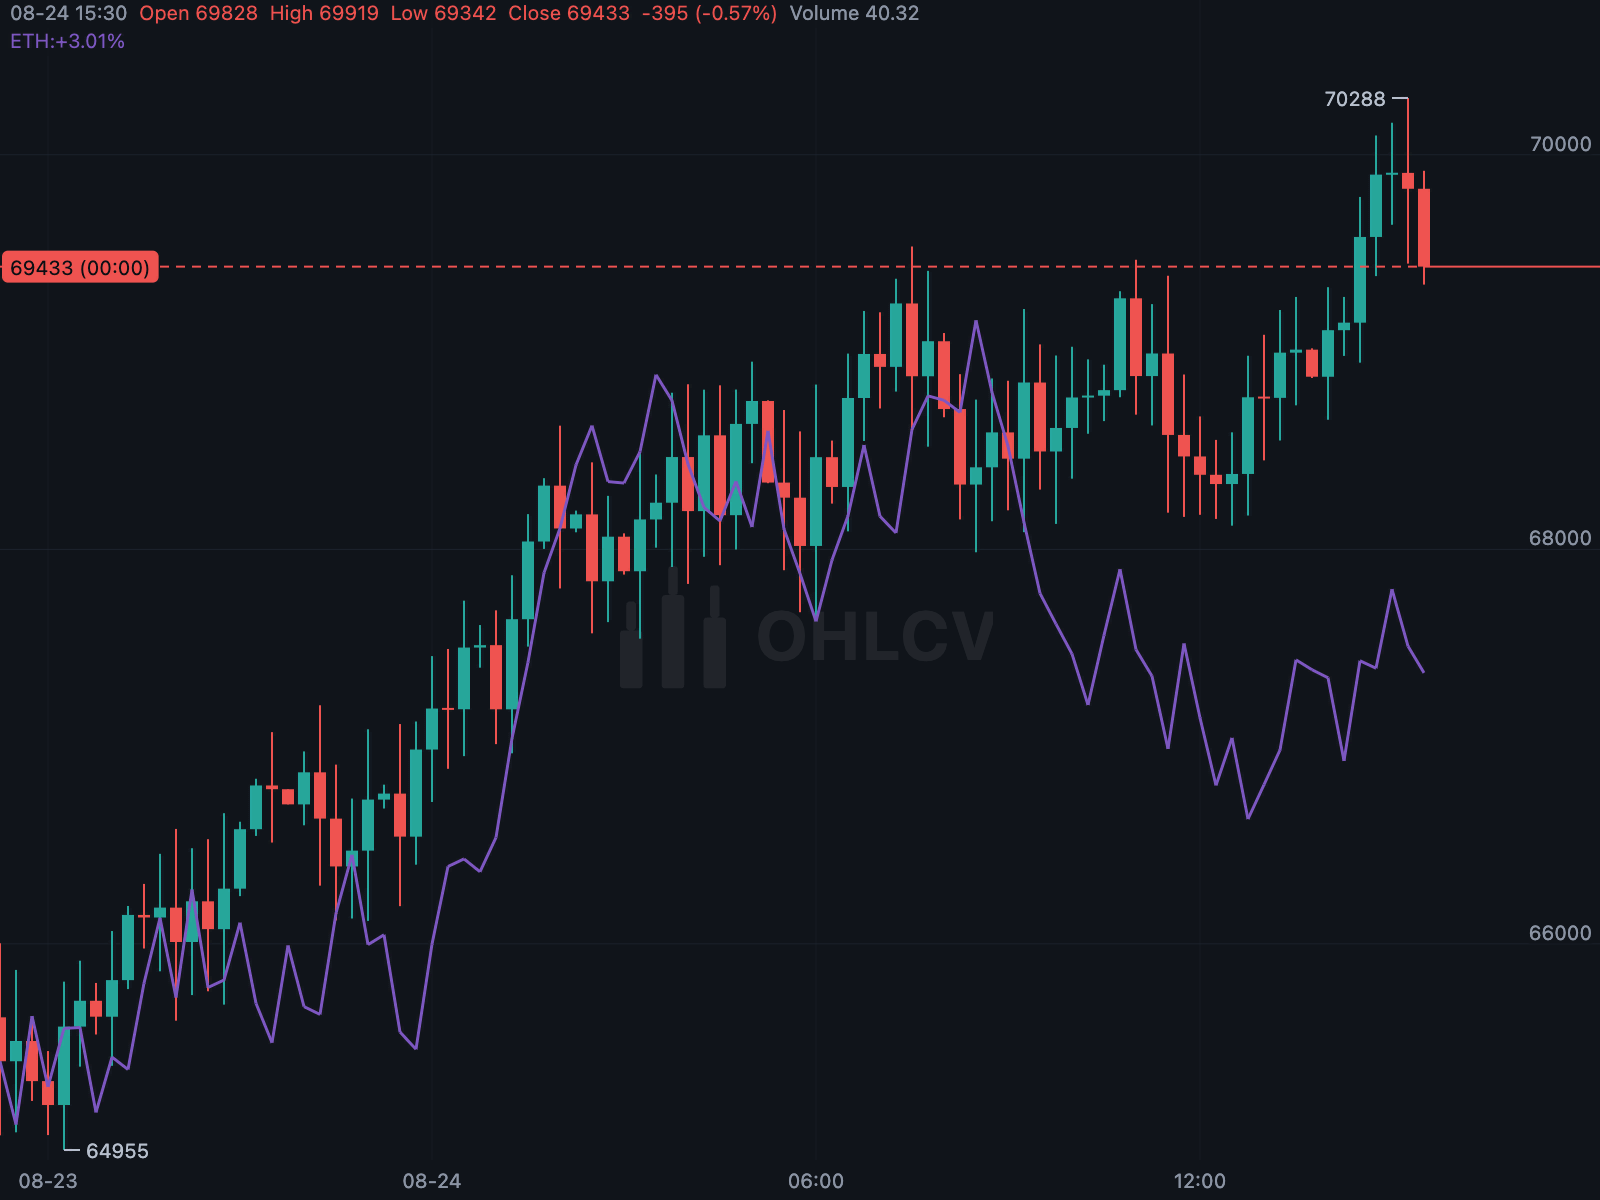 Symbol comparison Another instrument on the same axis, rebased or at actual prices. |
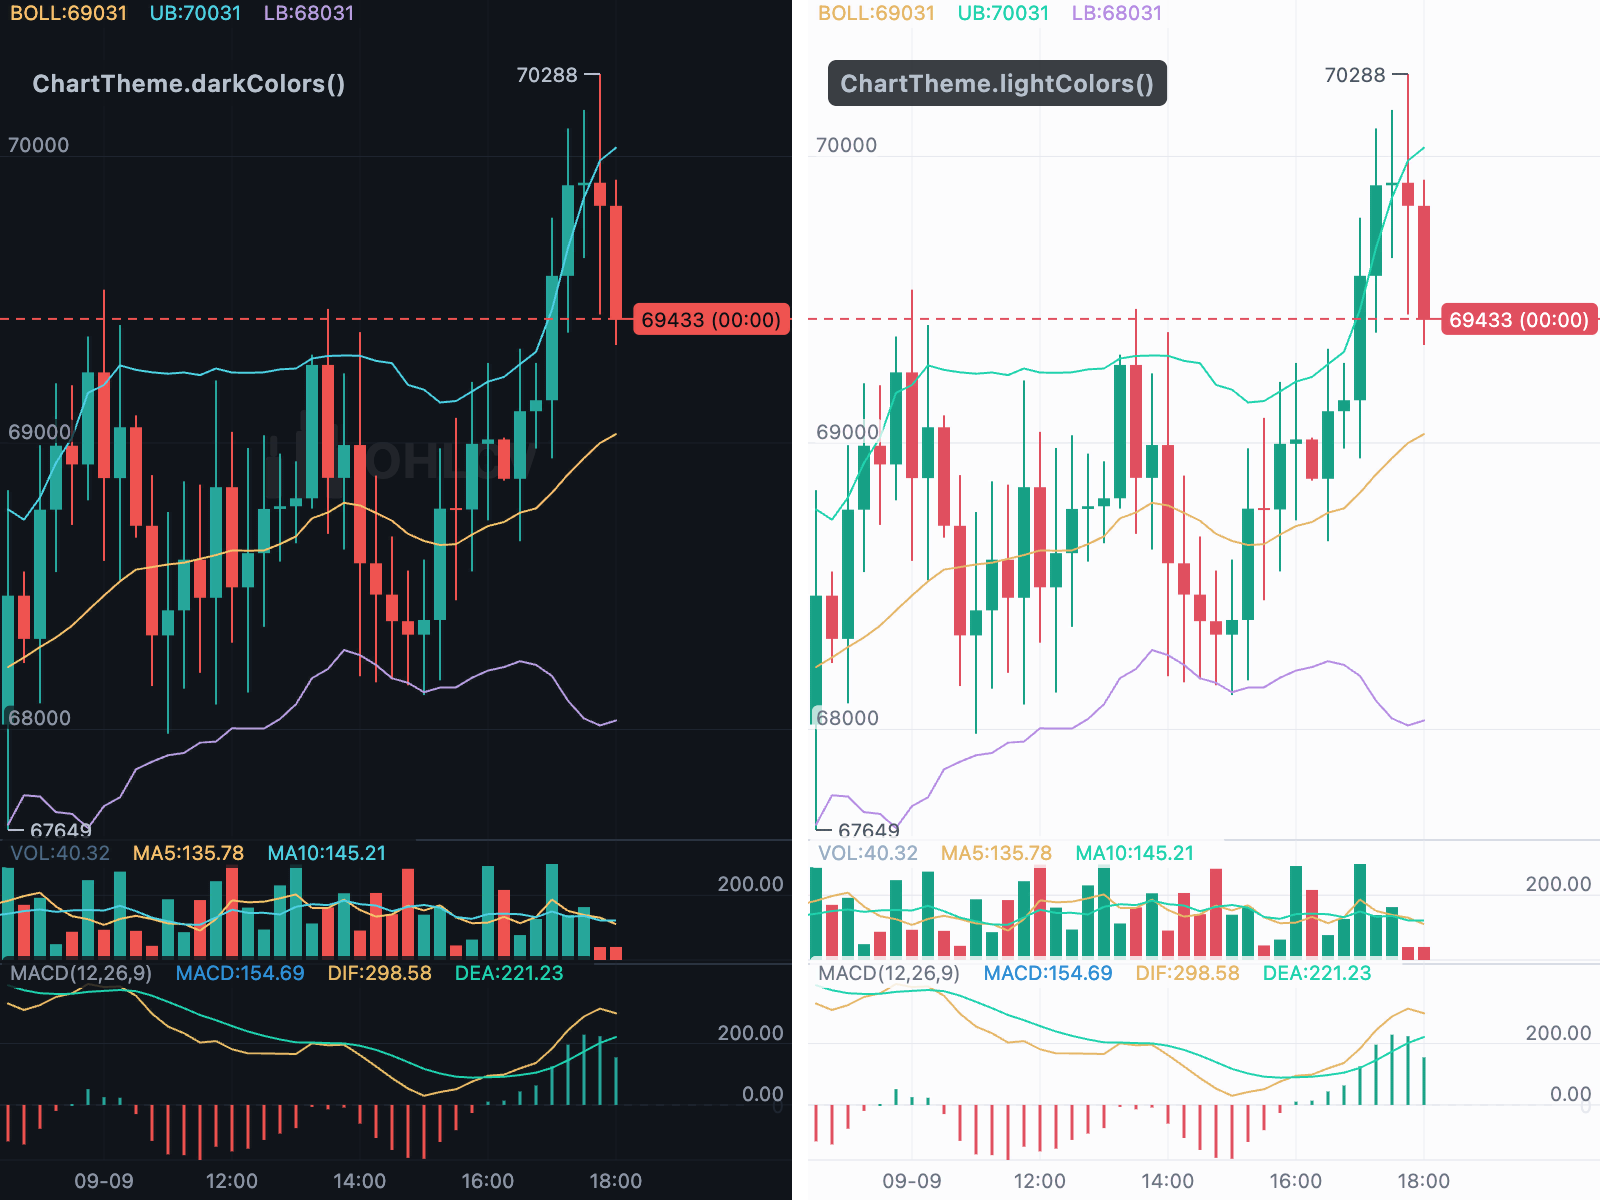 Dark and light The same chart in both themes, with every colour configurable. |
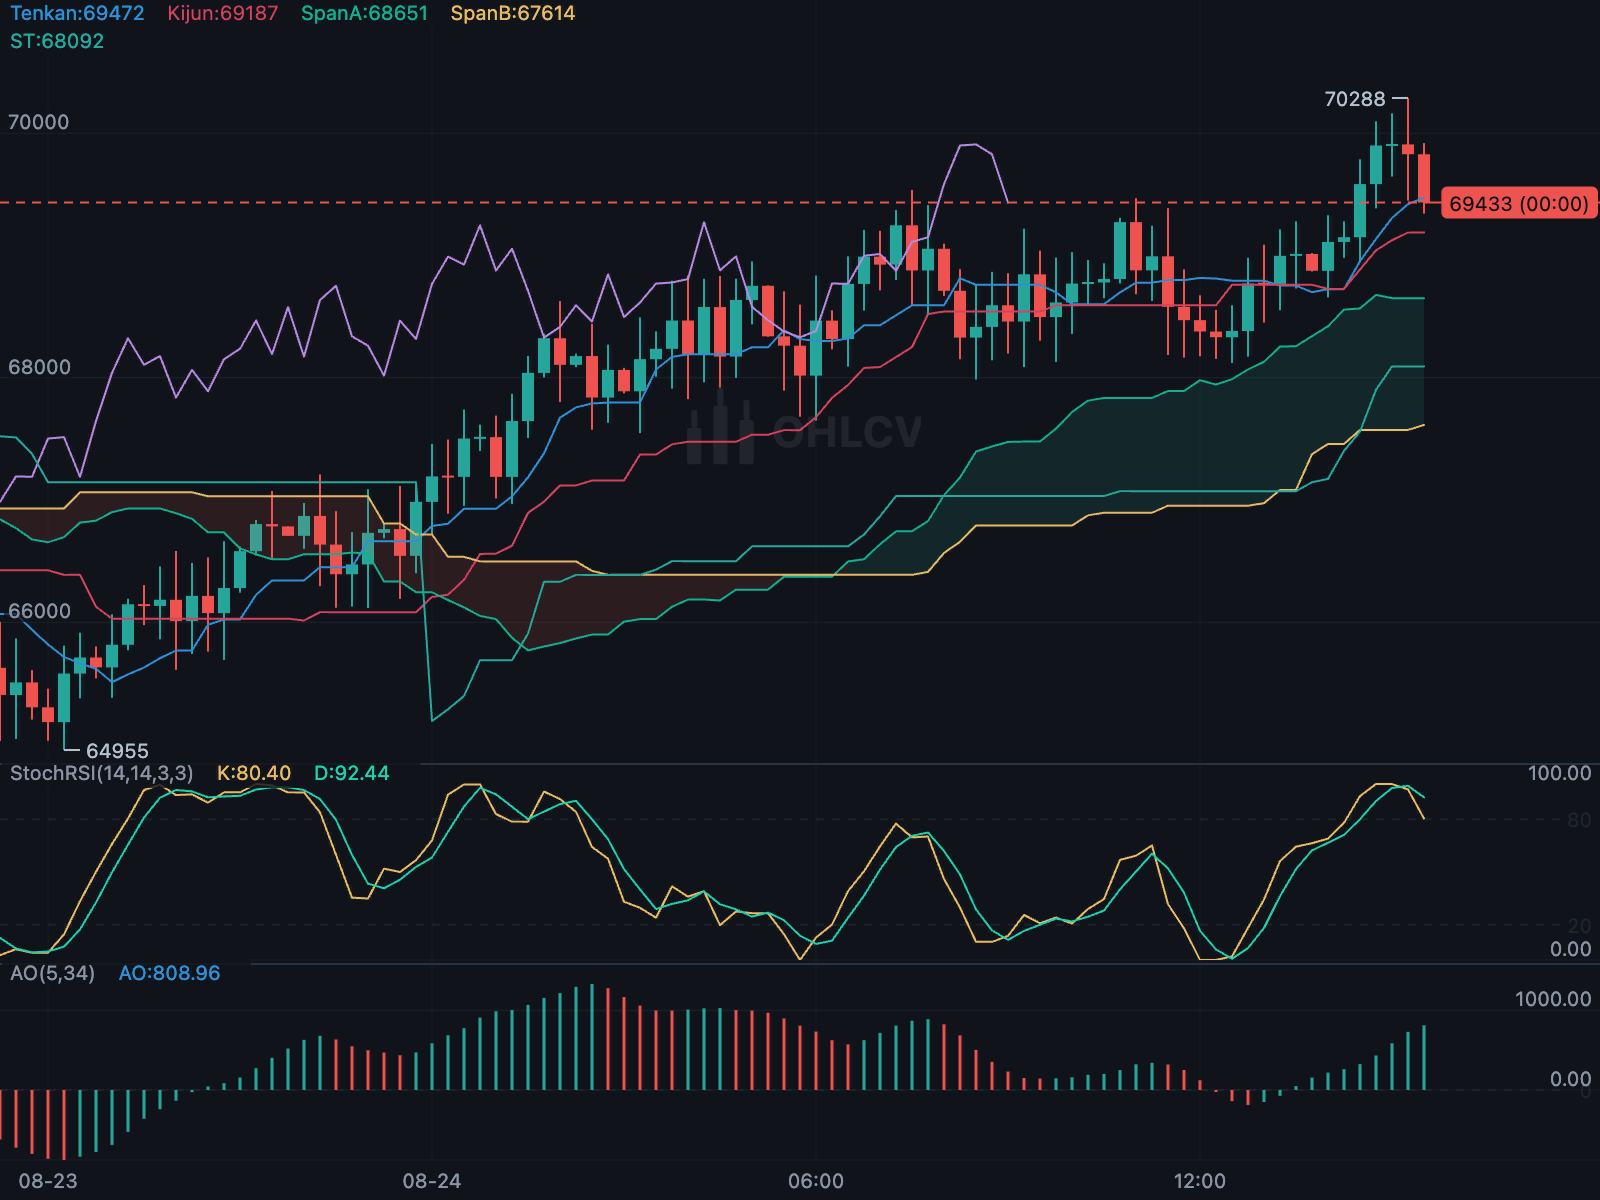 Main-chart overlays Ichimoku Cloud and Supertrend, with Stochastic RSI and Awesome Oscillator panes. |
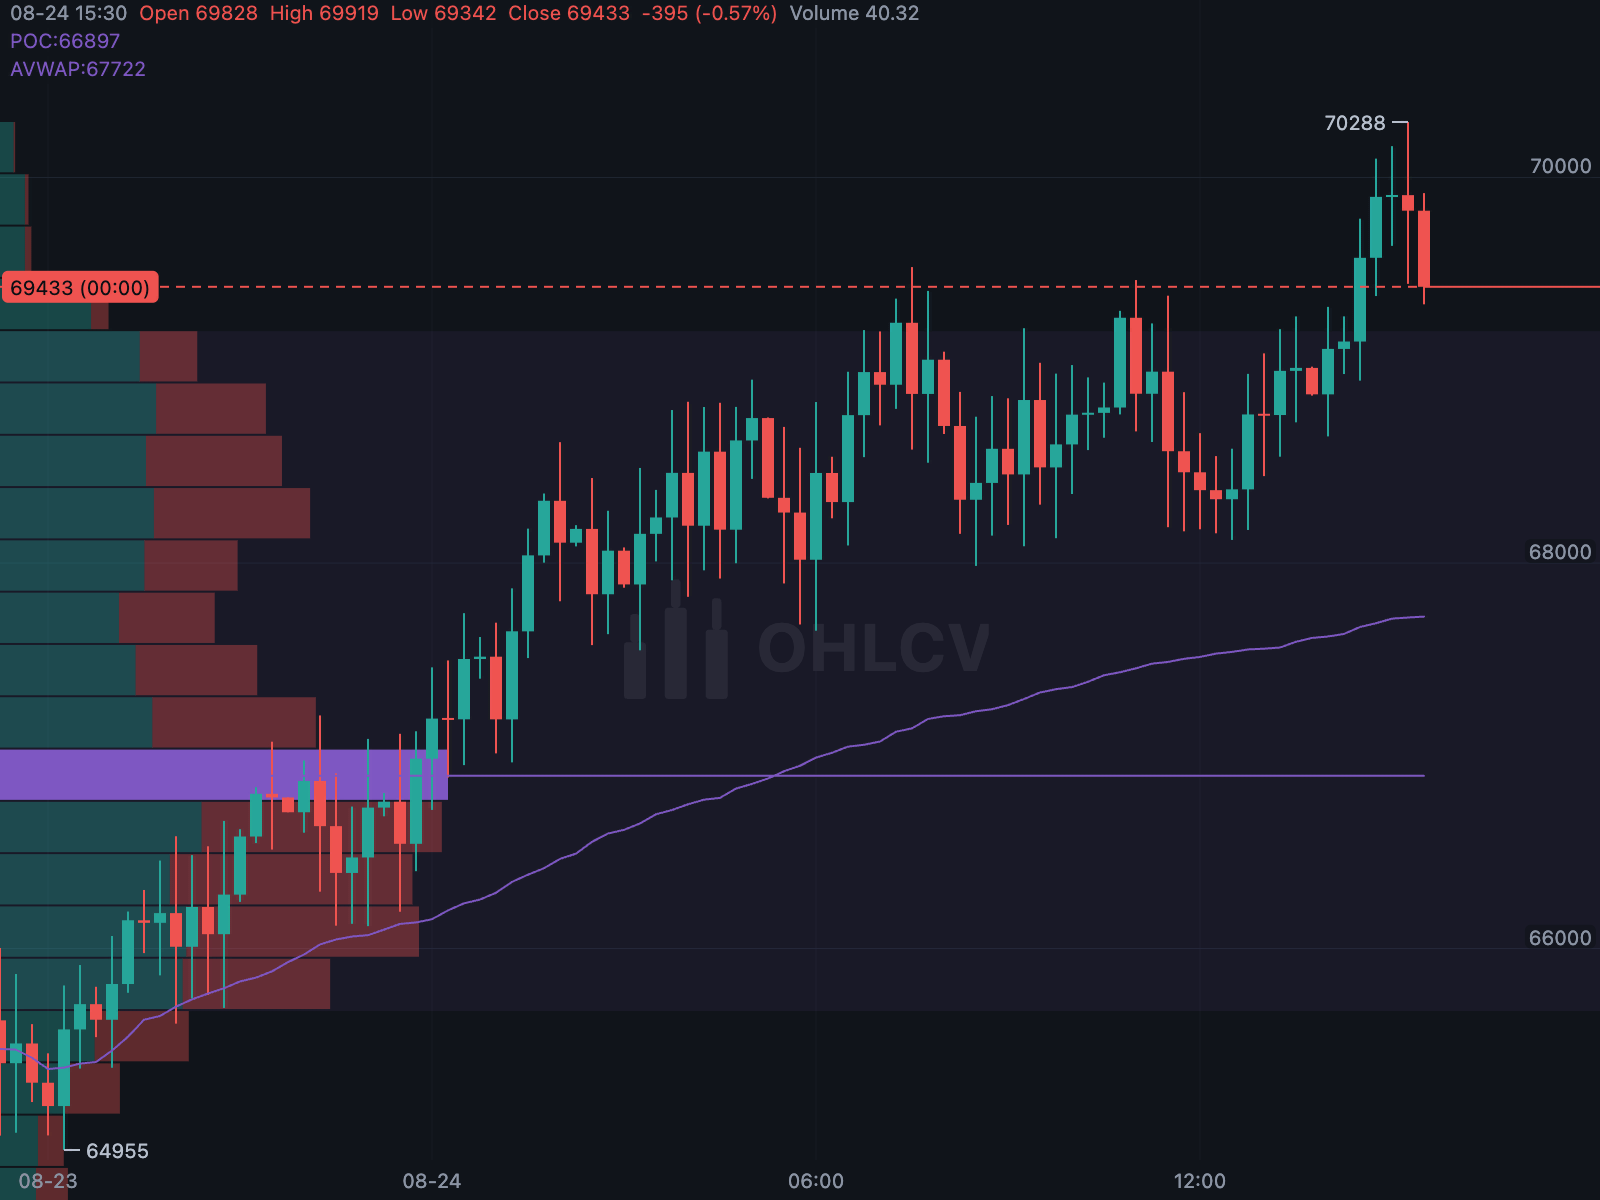 Profile and anchored VWAP A volume profile and a VWAP anchored to a candle. |
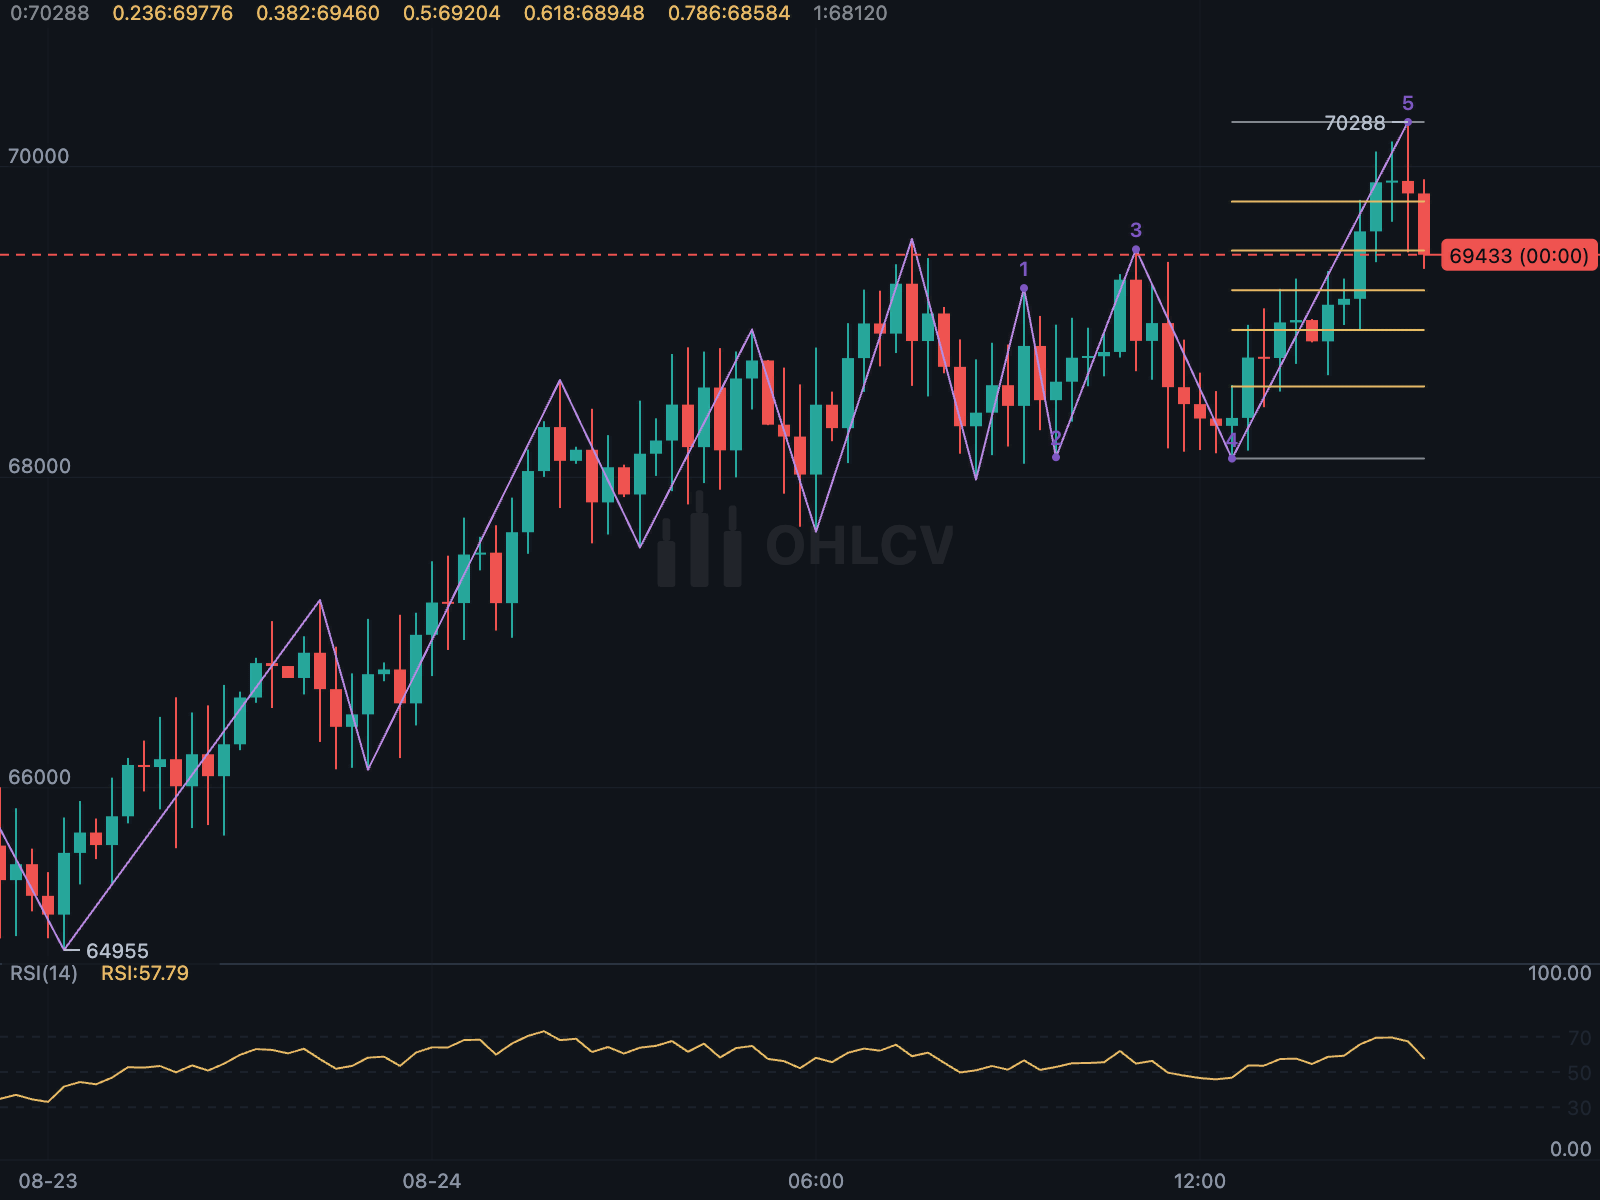 Swing analysis ZigZag, Fibonacci retracement and Elliott wave labels. |
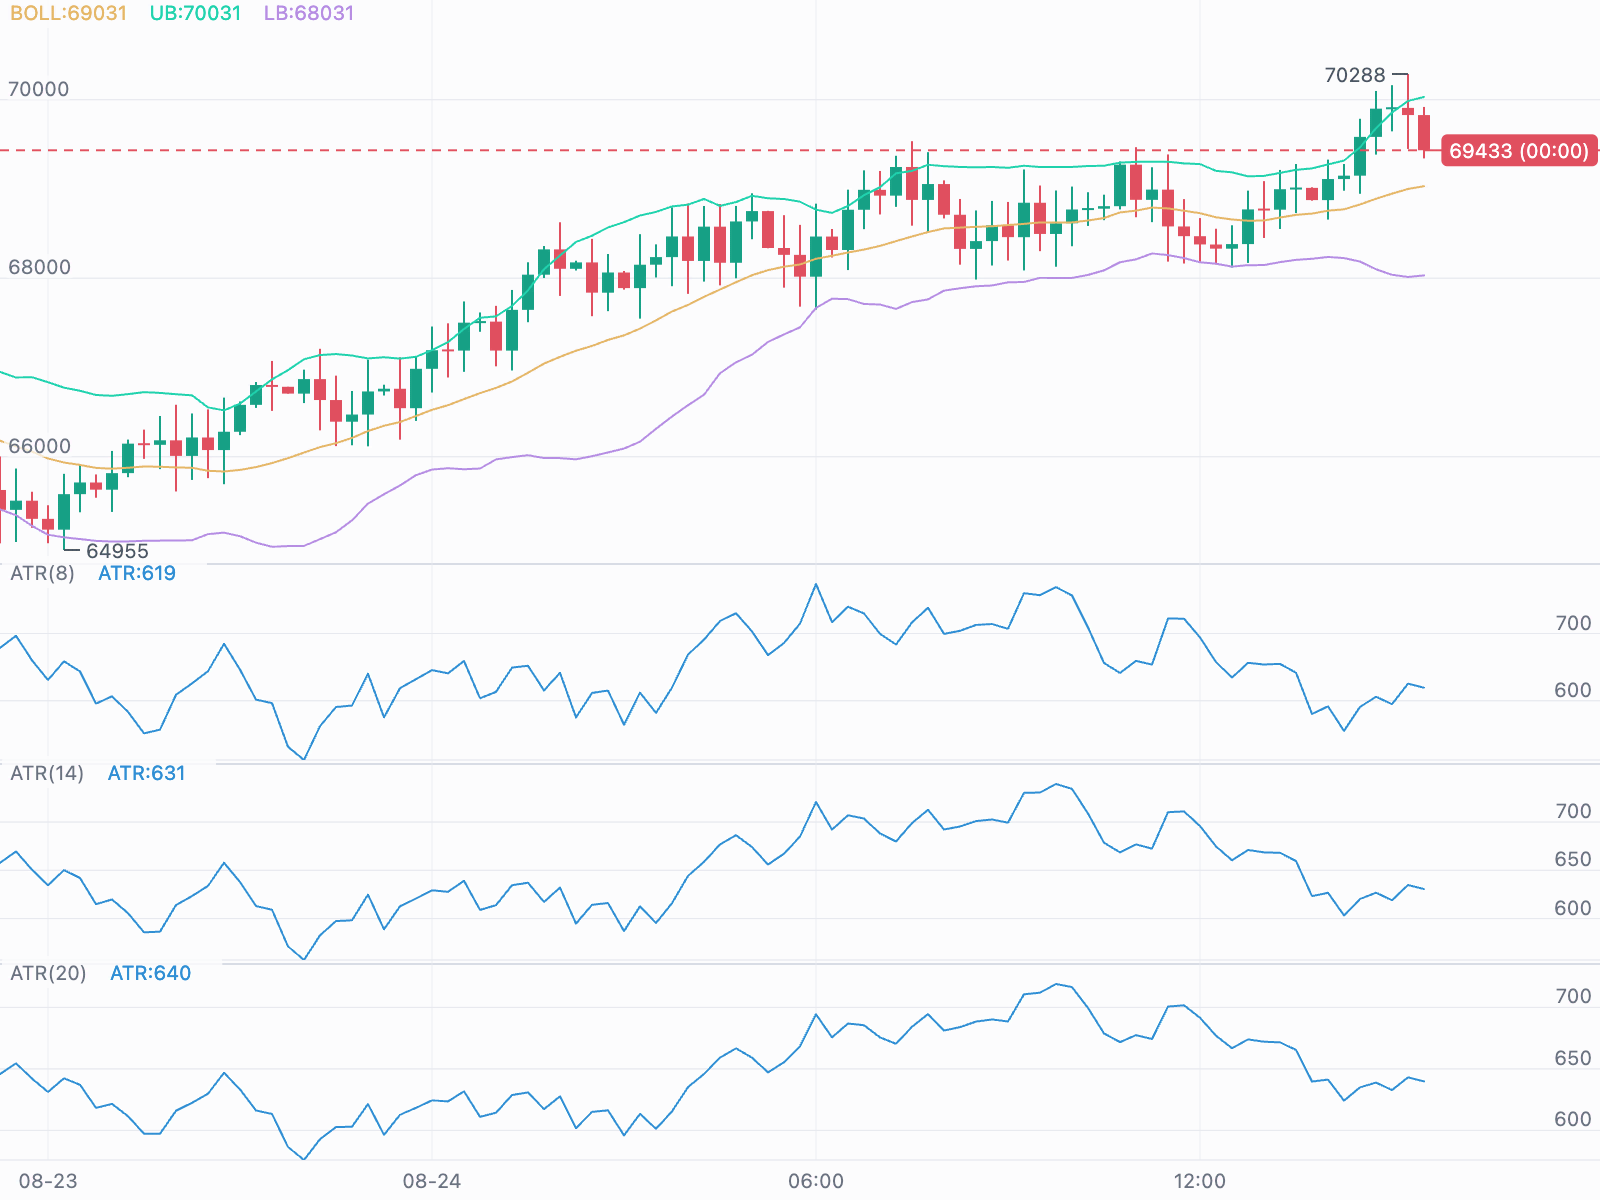 Stacked panes Three ATR periods, each in its own resizable pane. |
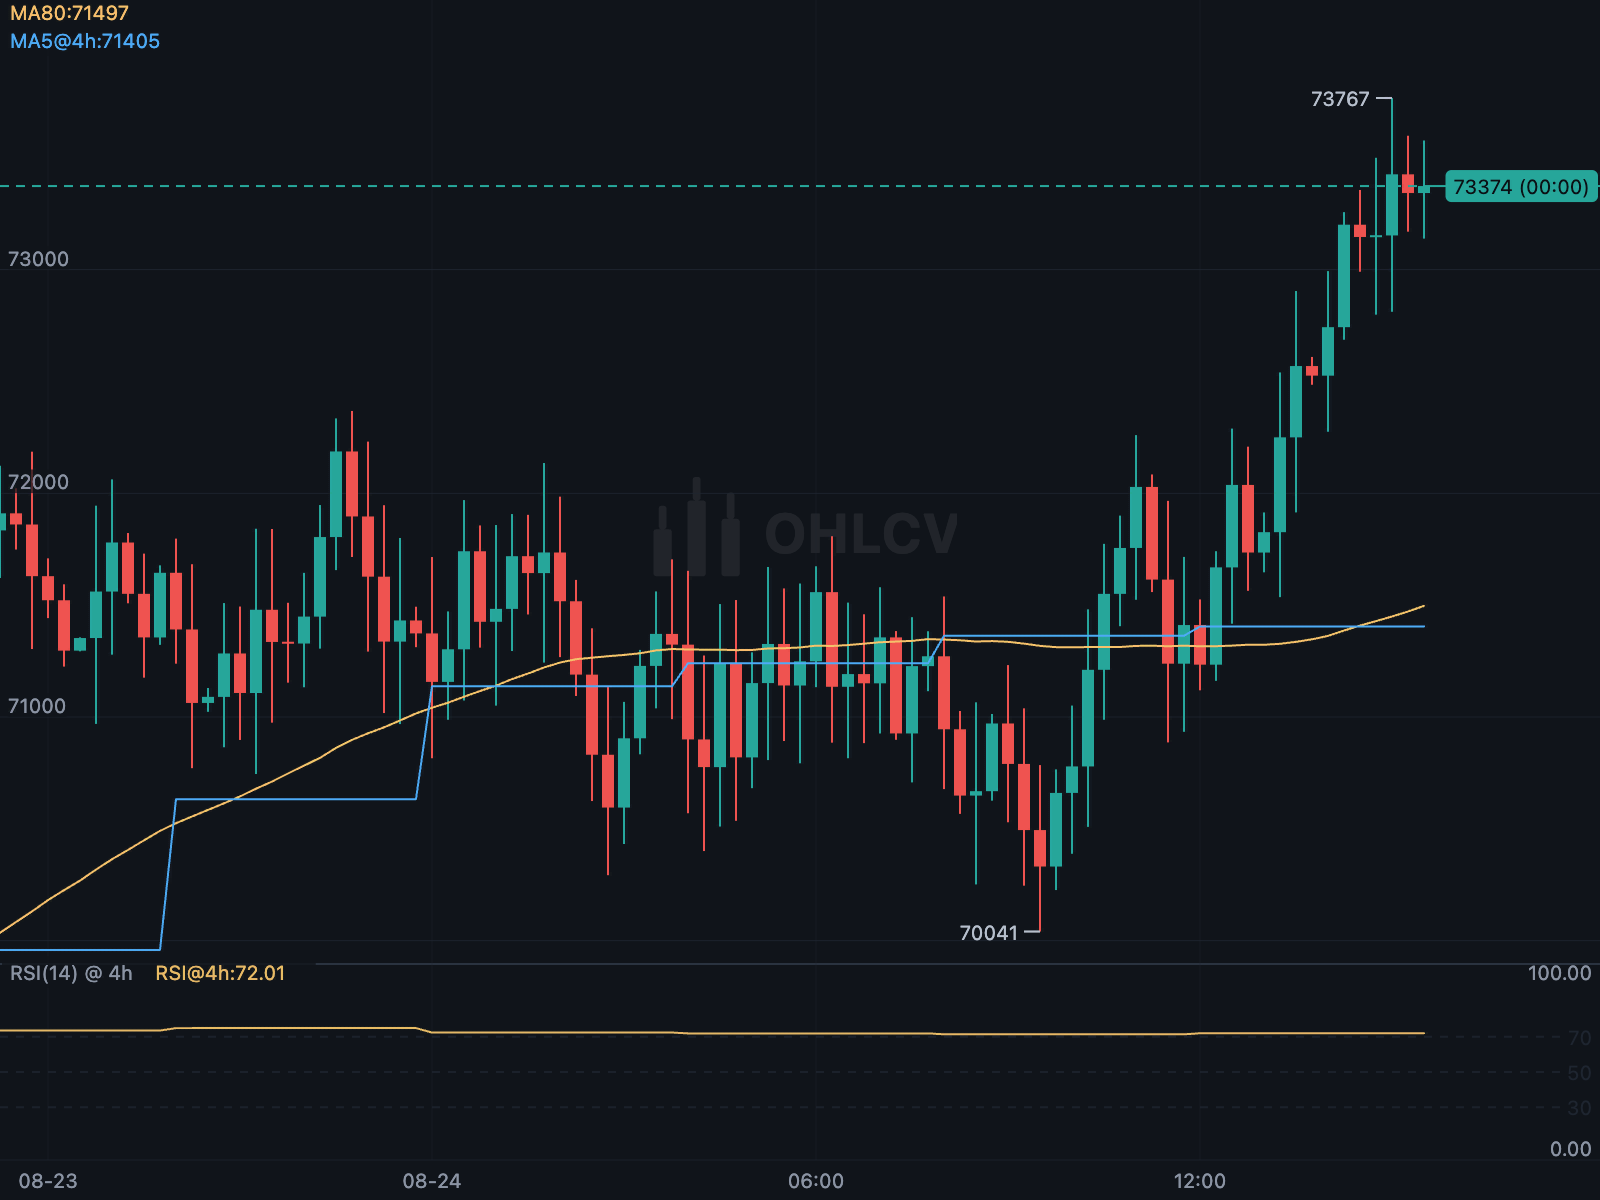 Higher timeframes A four-hour moving average and RSI on 15-minute candles. |
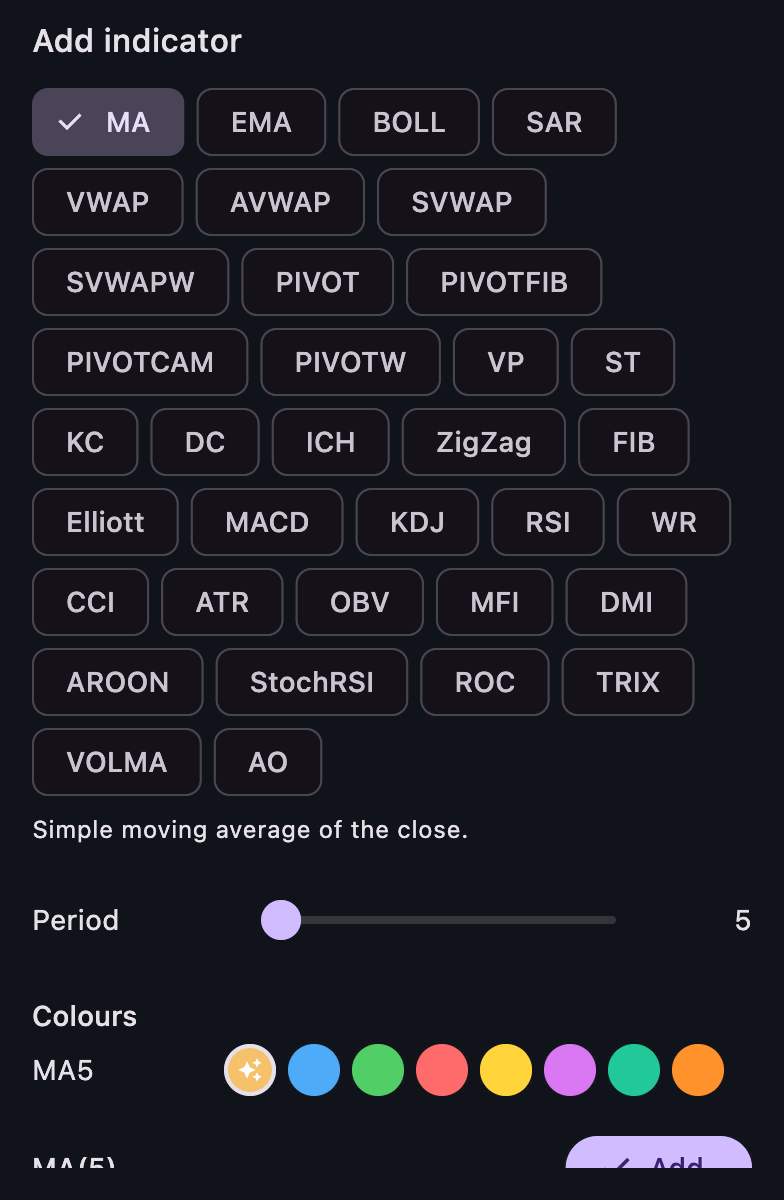 Indicator catalogue The example app's indicator picker, generated from the catalogue. |
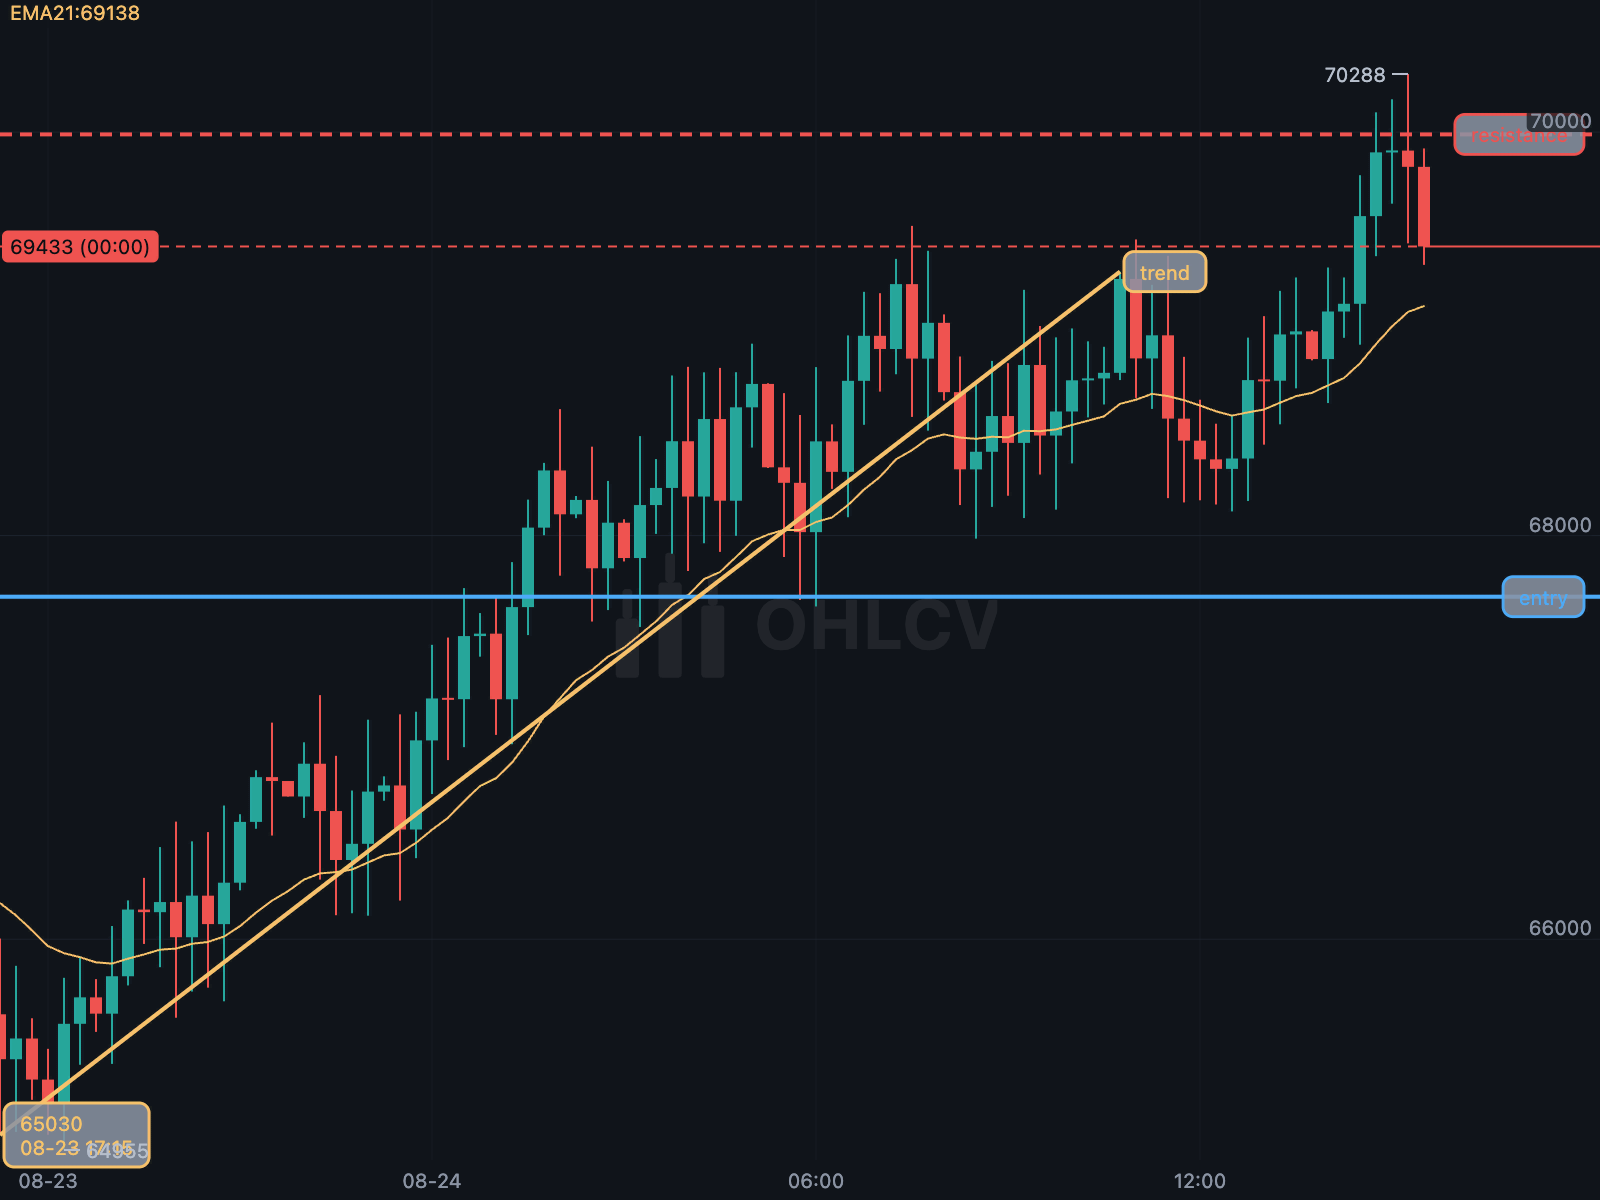 29 drawing tools Labelled trend and horizontal lines, with snapping and persistence. |
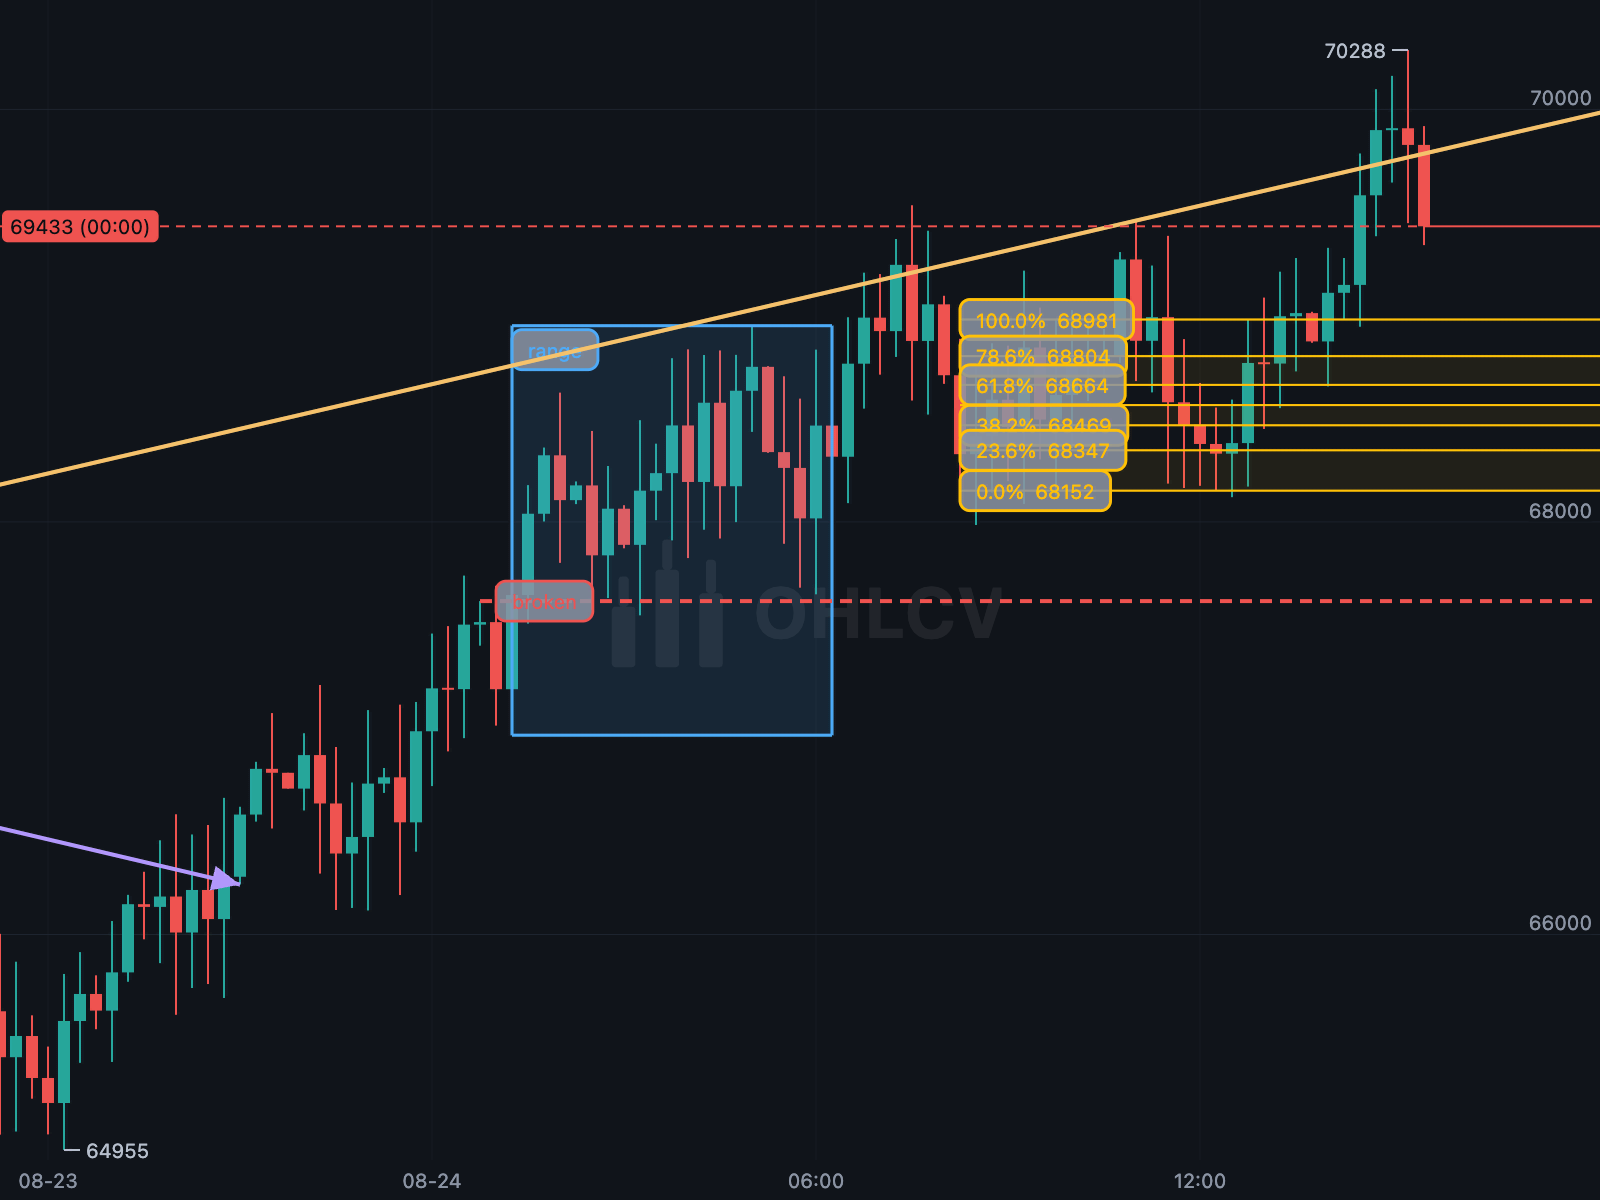 Rays, boxes and Fibonacci A ray, an arrow, a horizontal ray, a range box and a Fibonacci retracement. |
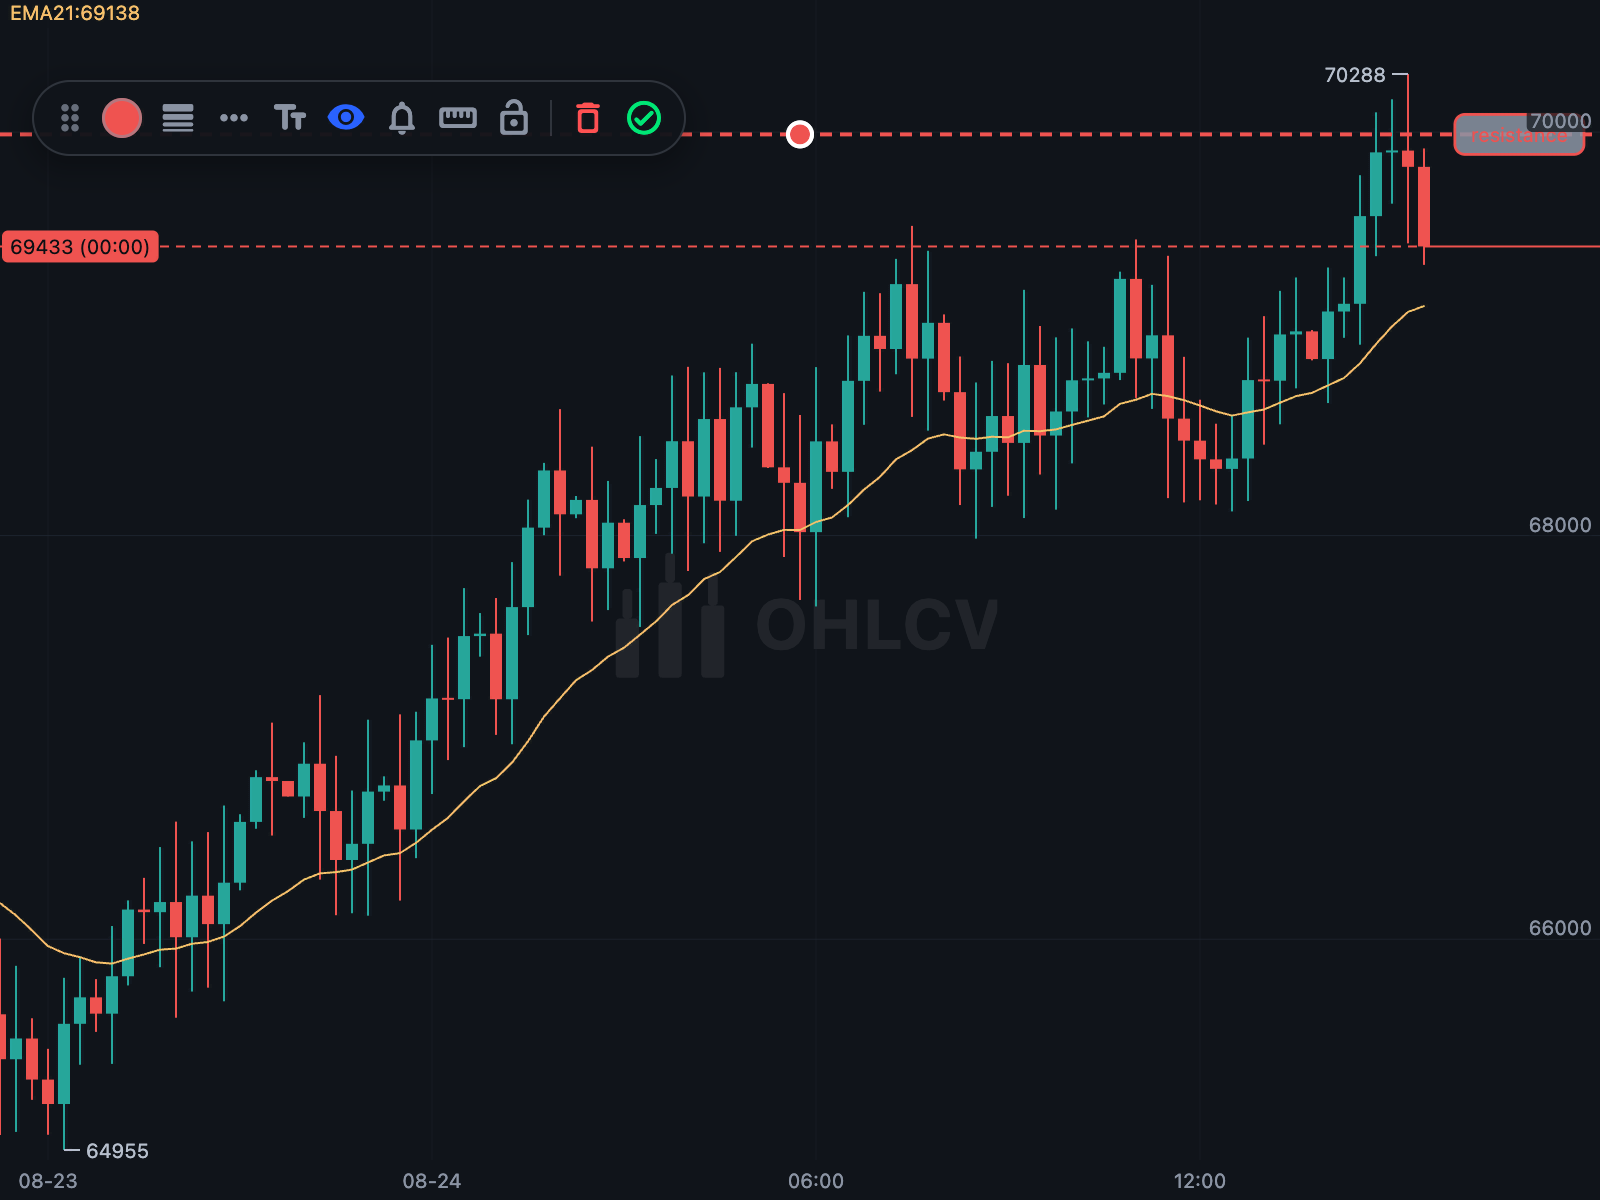 The line editor Controls for the selected drawing, customisable through DrawingStyle. |
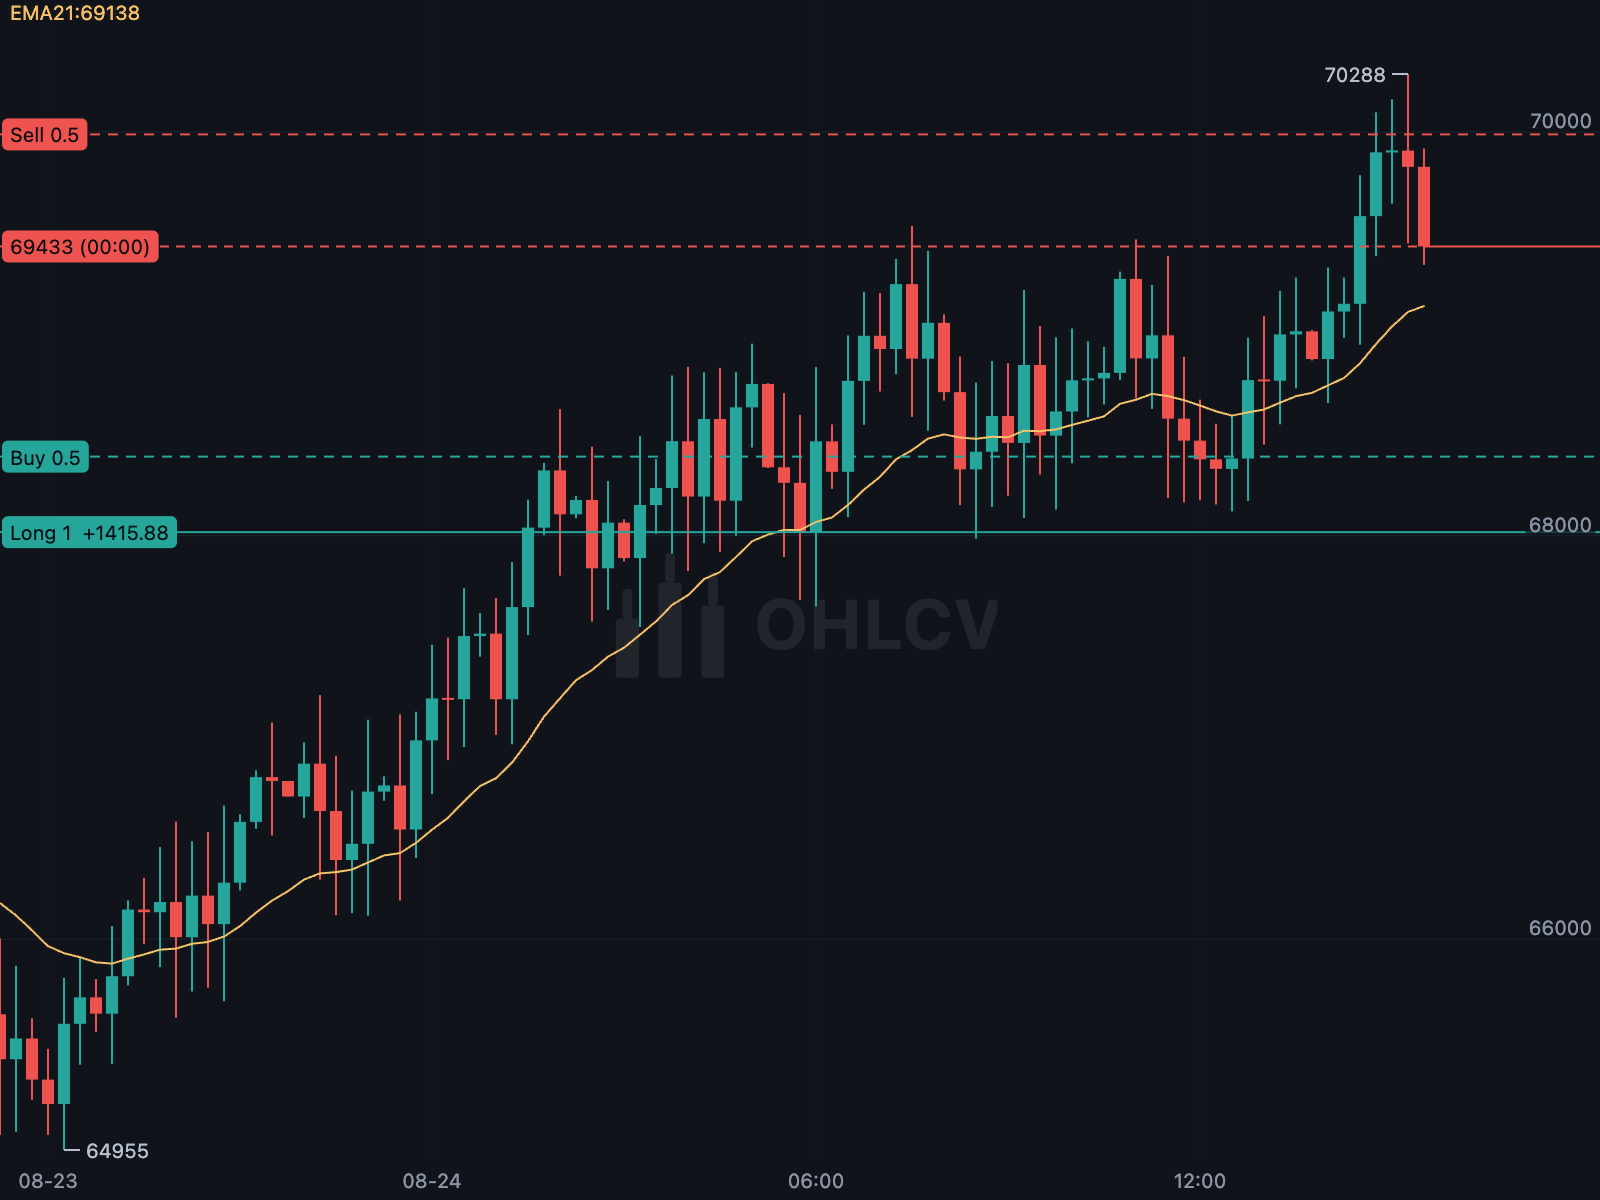 Orders and positions A working order and an open position, each labelled on the axis. |
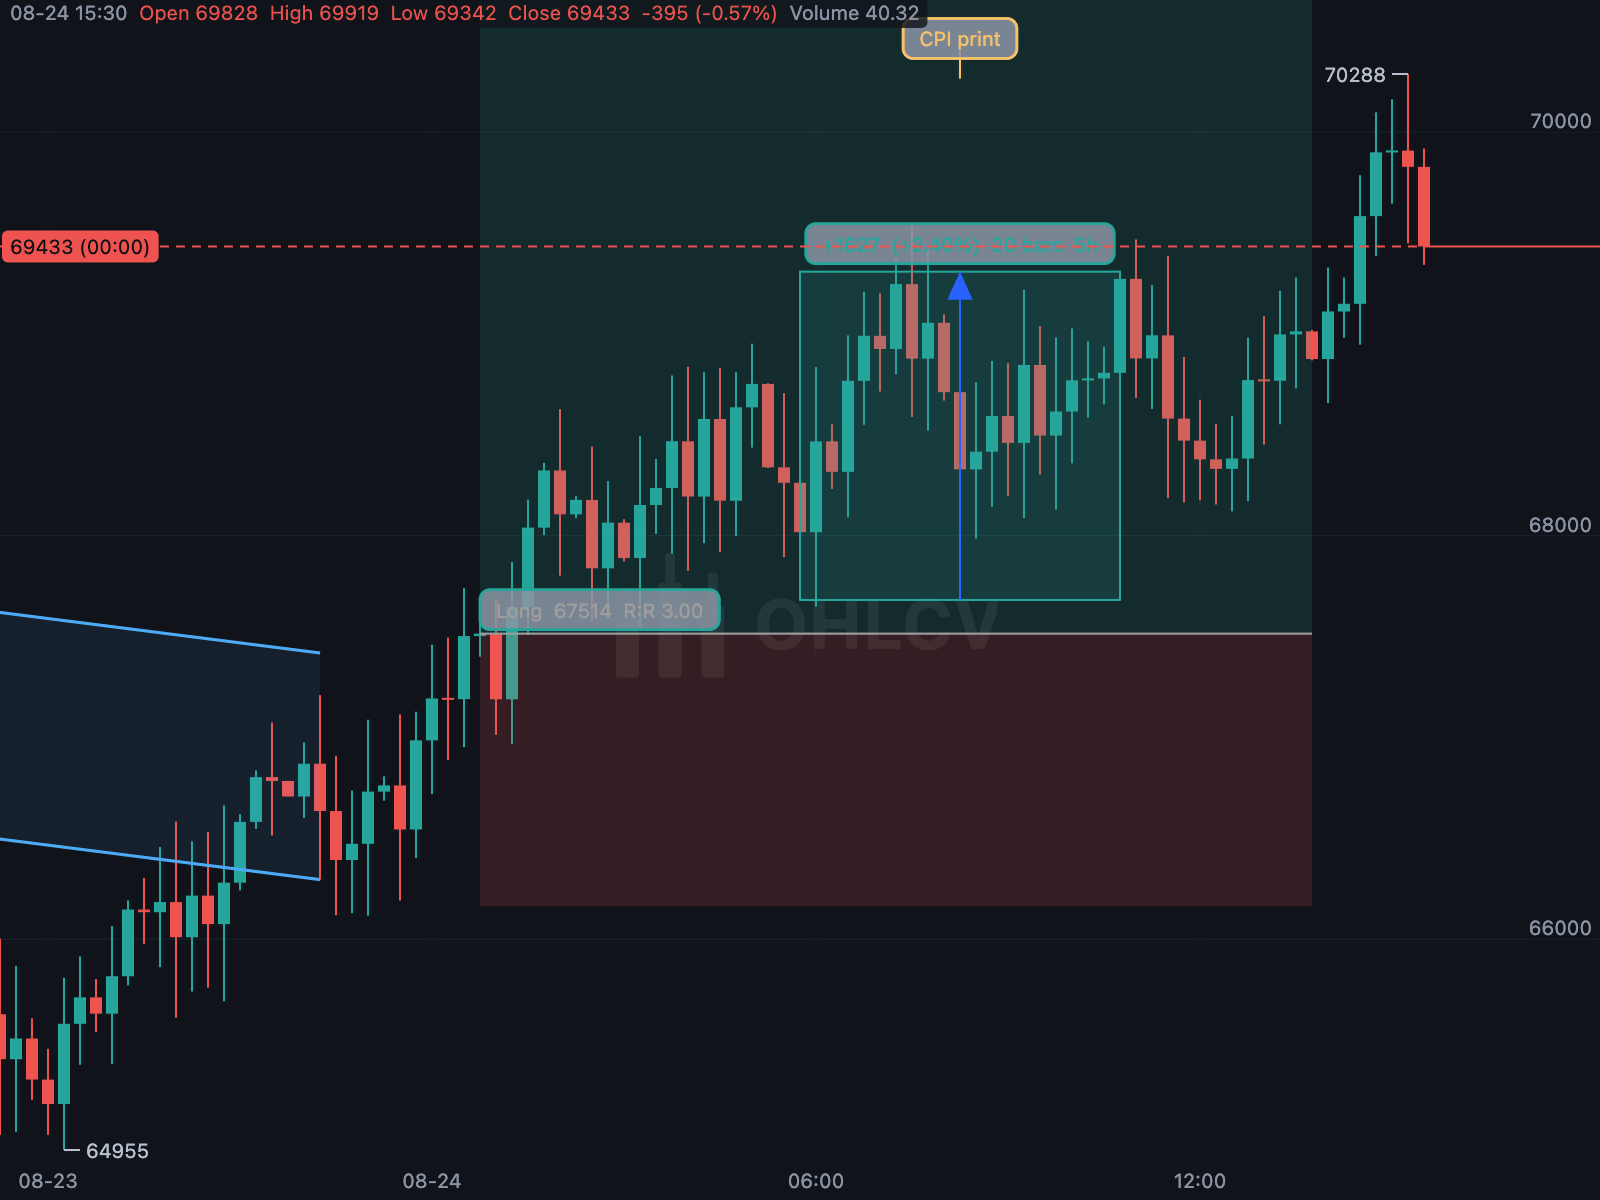 Planning a trade A planned position with risk-to-reward, inside a channel. |
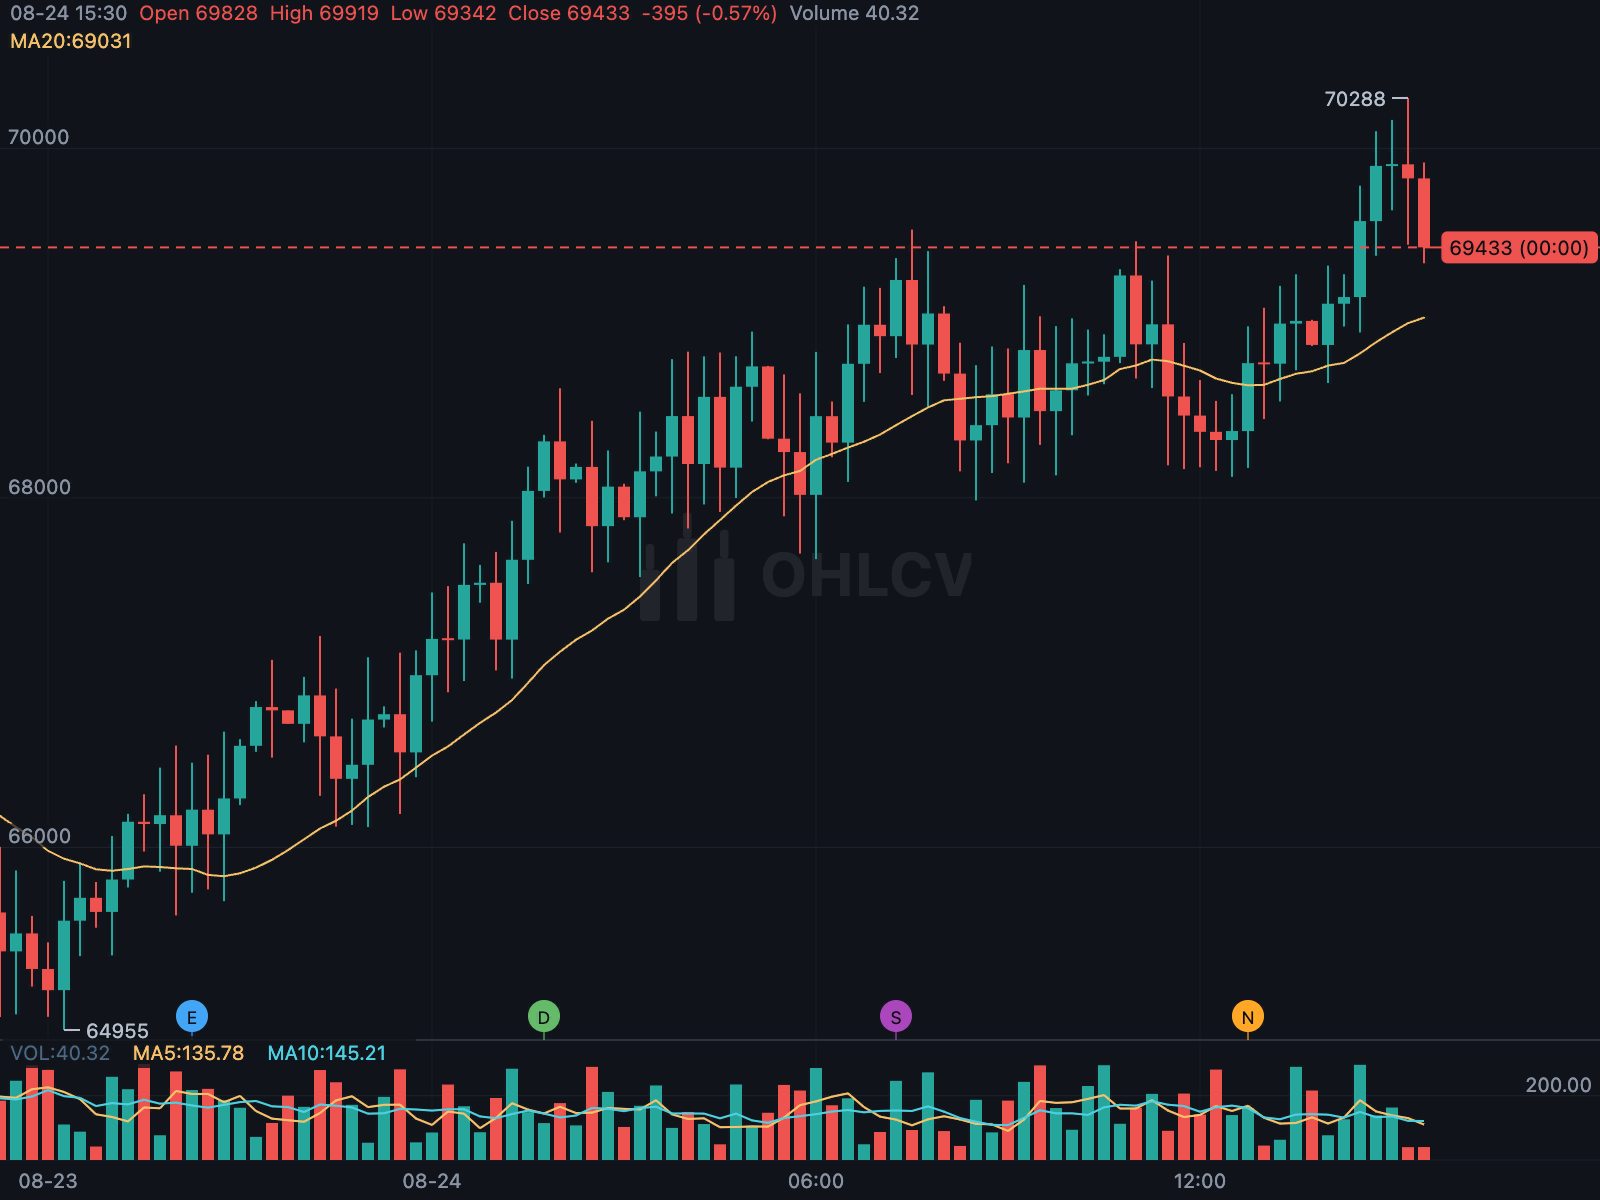 Event marks Earnings, dividend, split and news markers below the candles. |
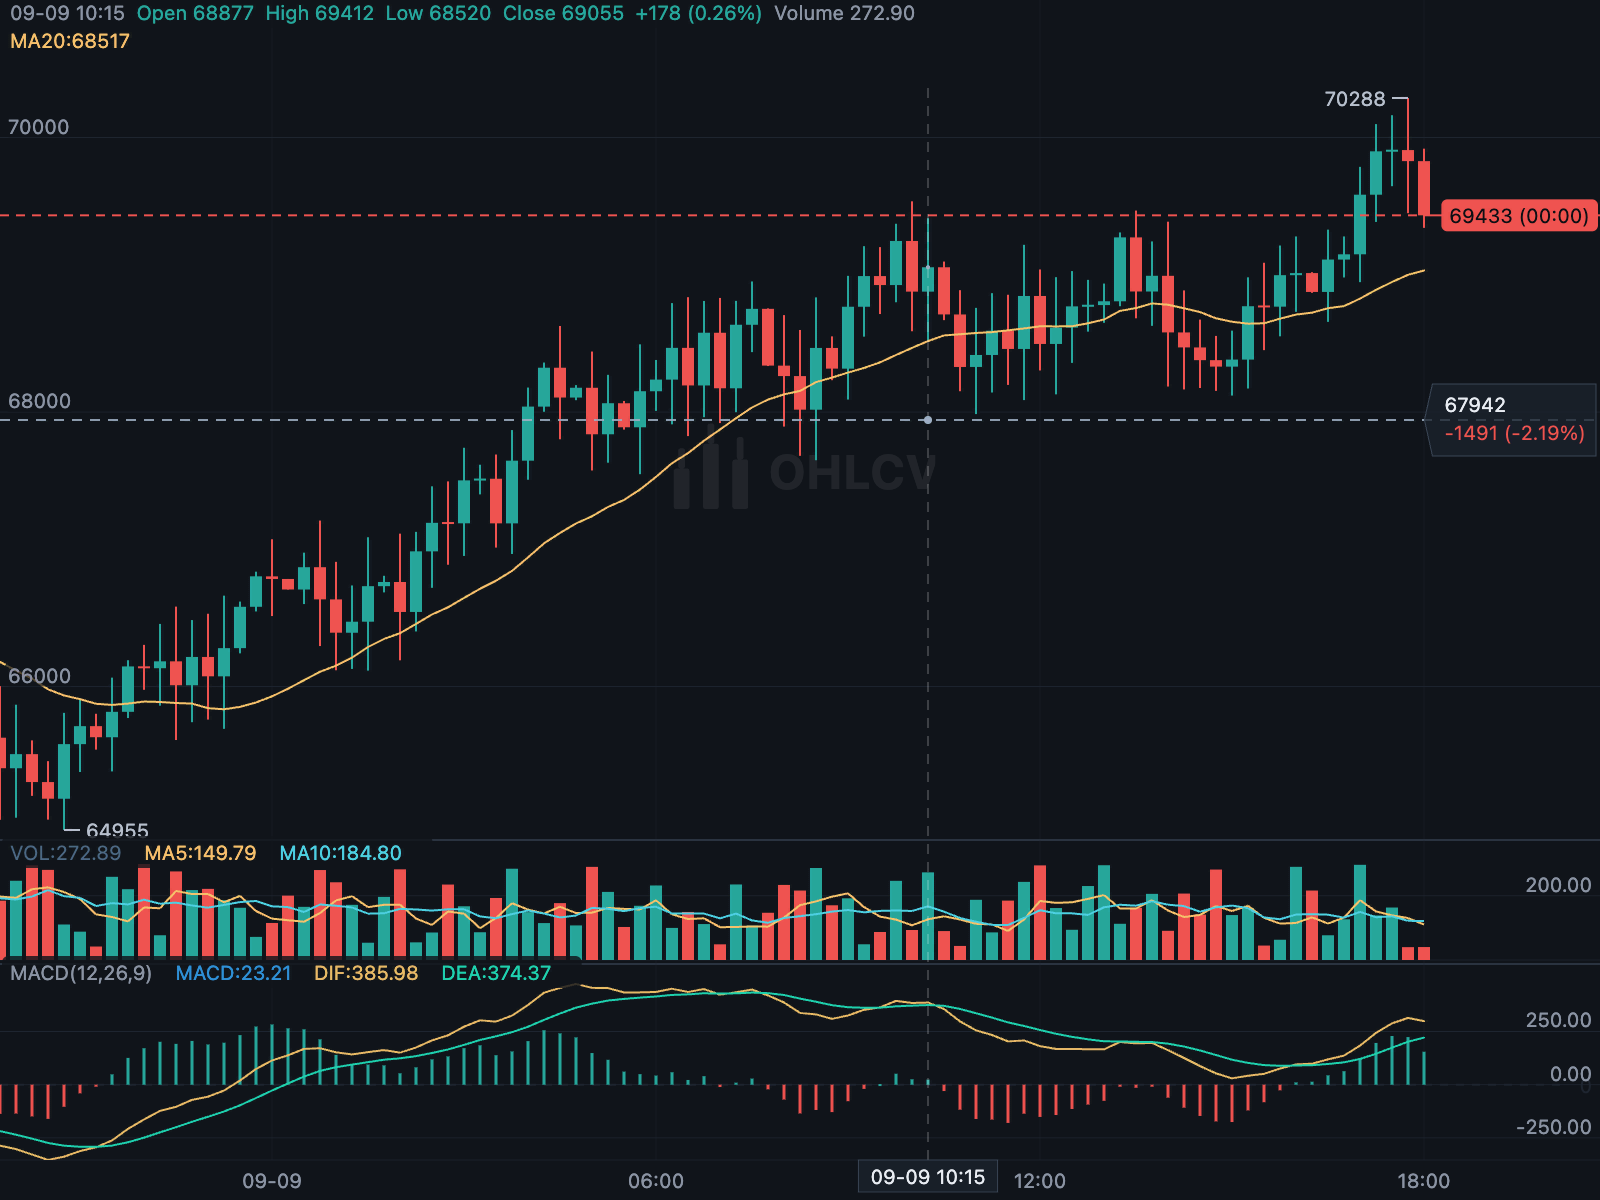 Legend and crosshair The OHLC legend, updated from the crosshair position. |
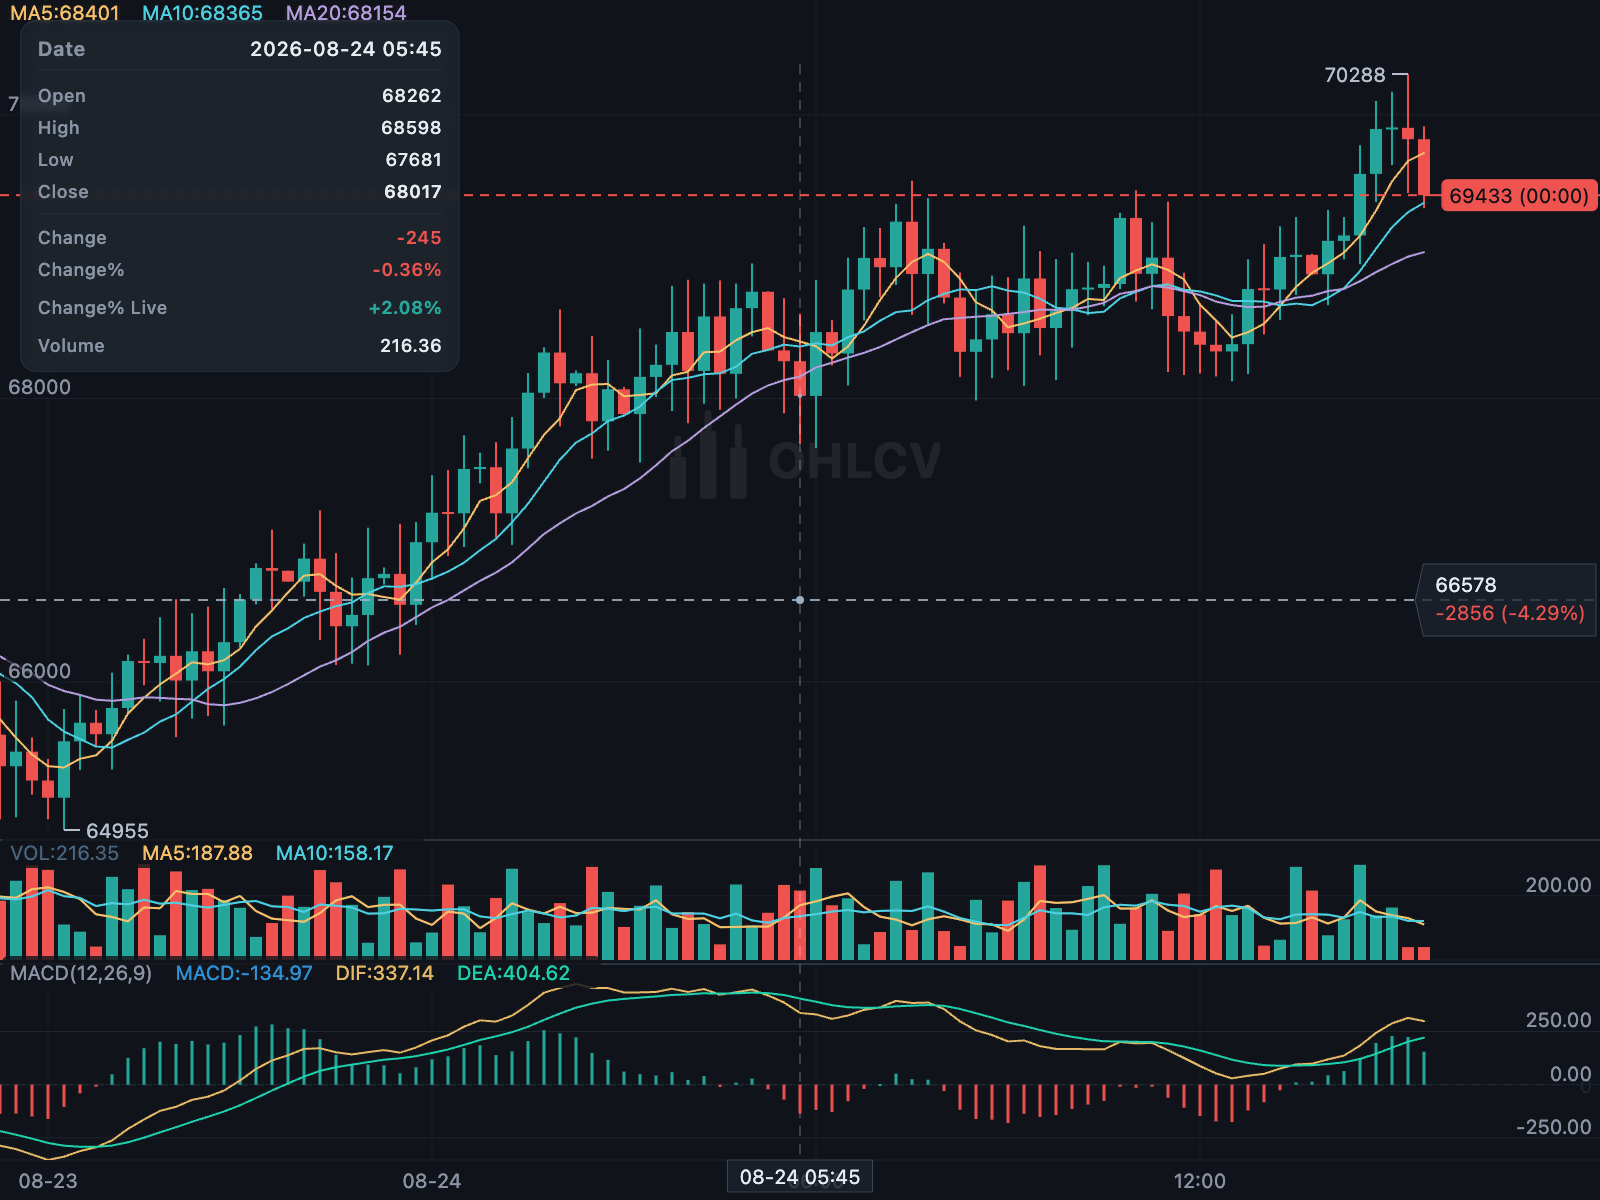 The long-press readout The built-in candle details card, or a custom builder. |
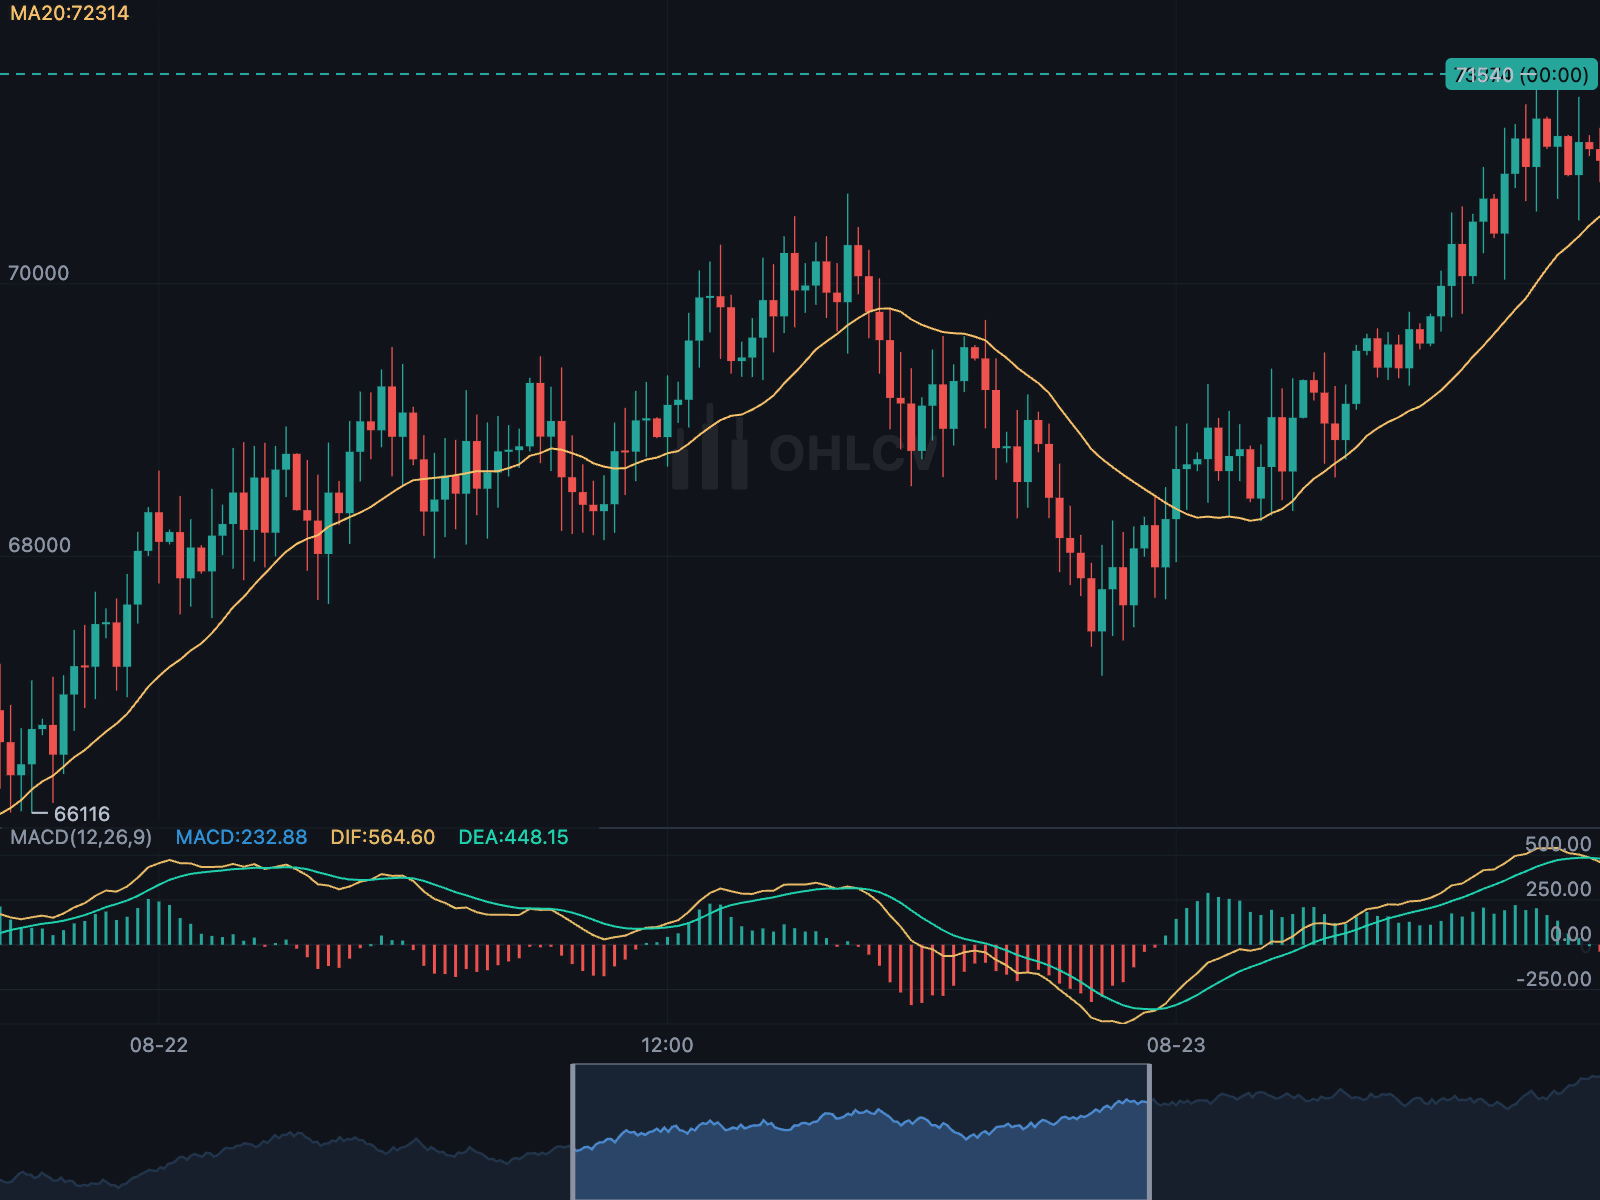 The overview strip The full series below the chart, with the visible range highlighted. |
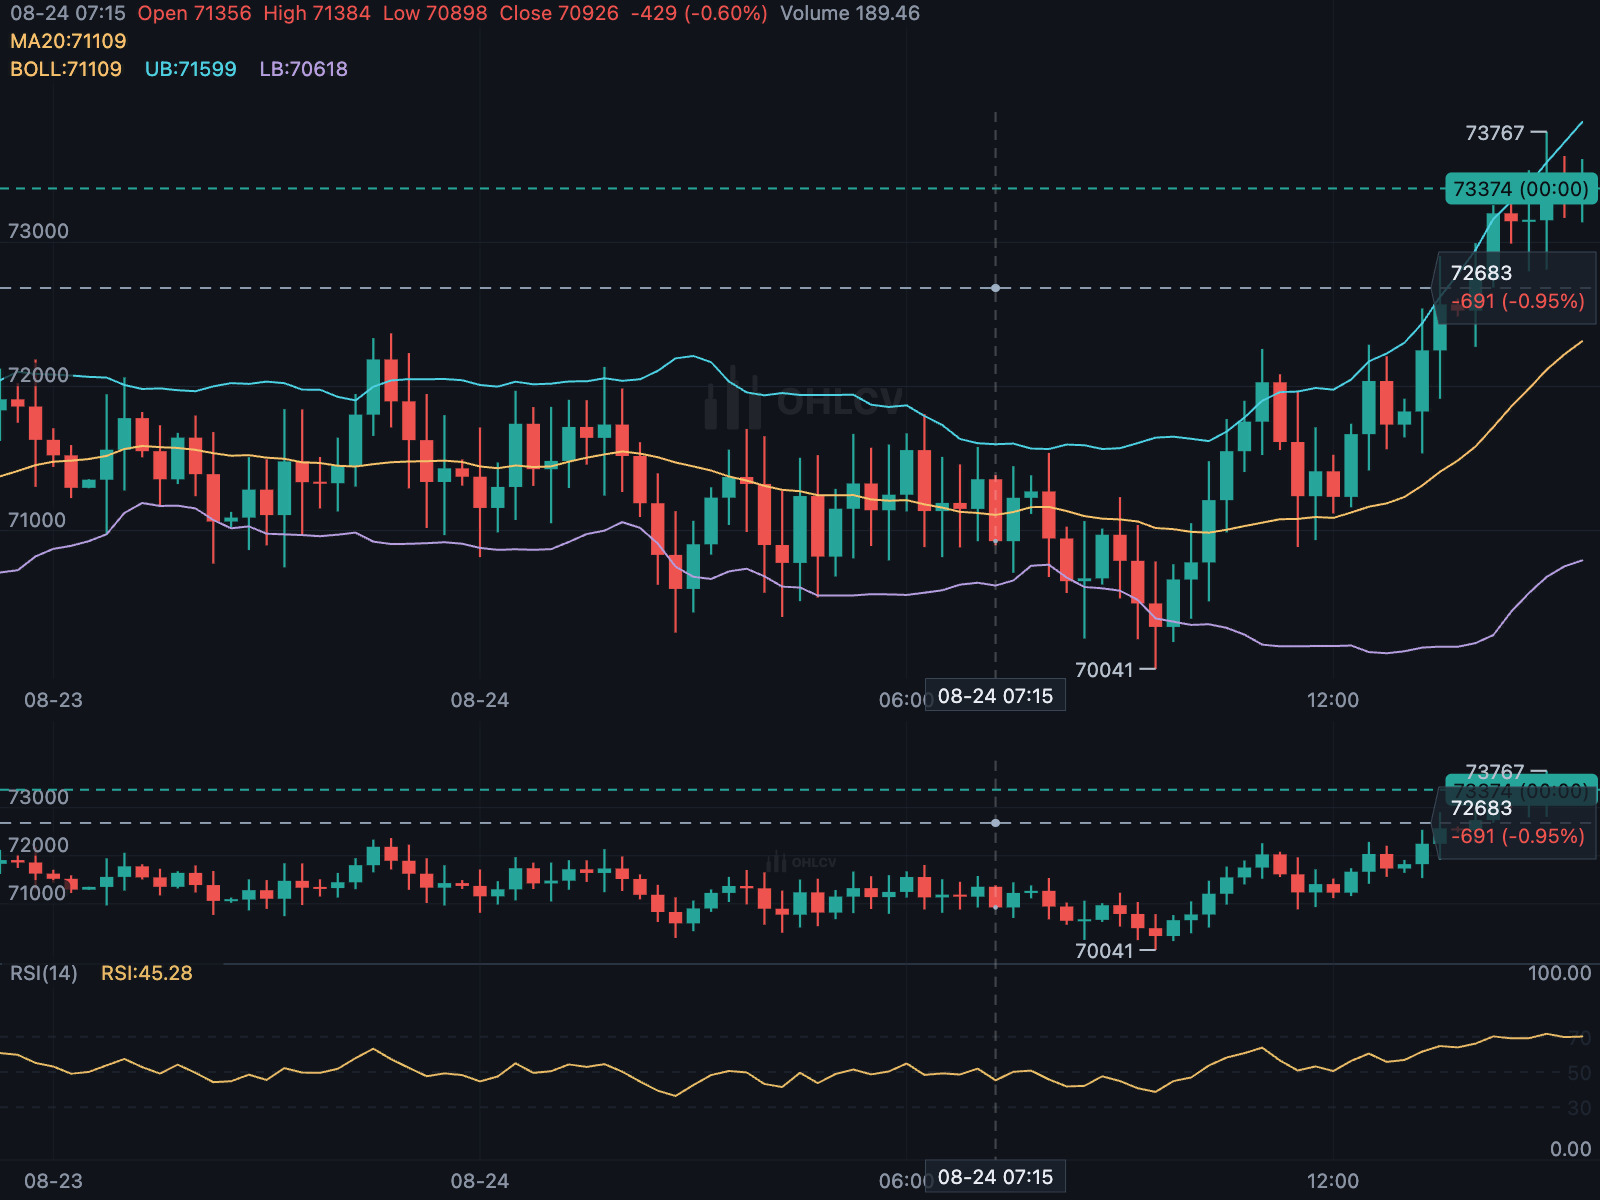 Linked charts Two charts with a synchronised crosshair. |
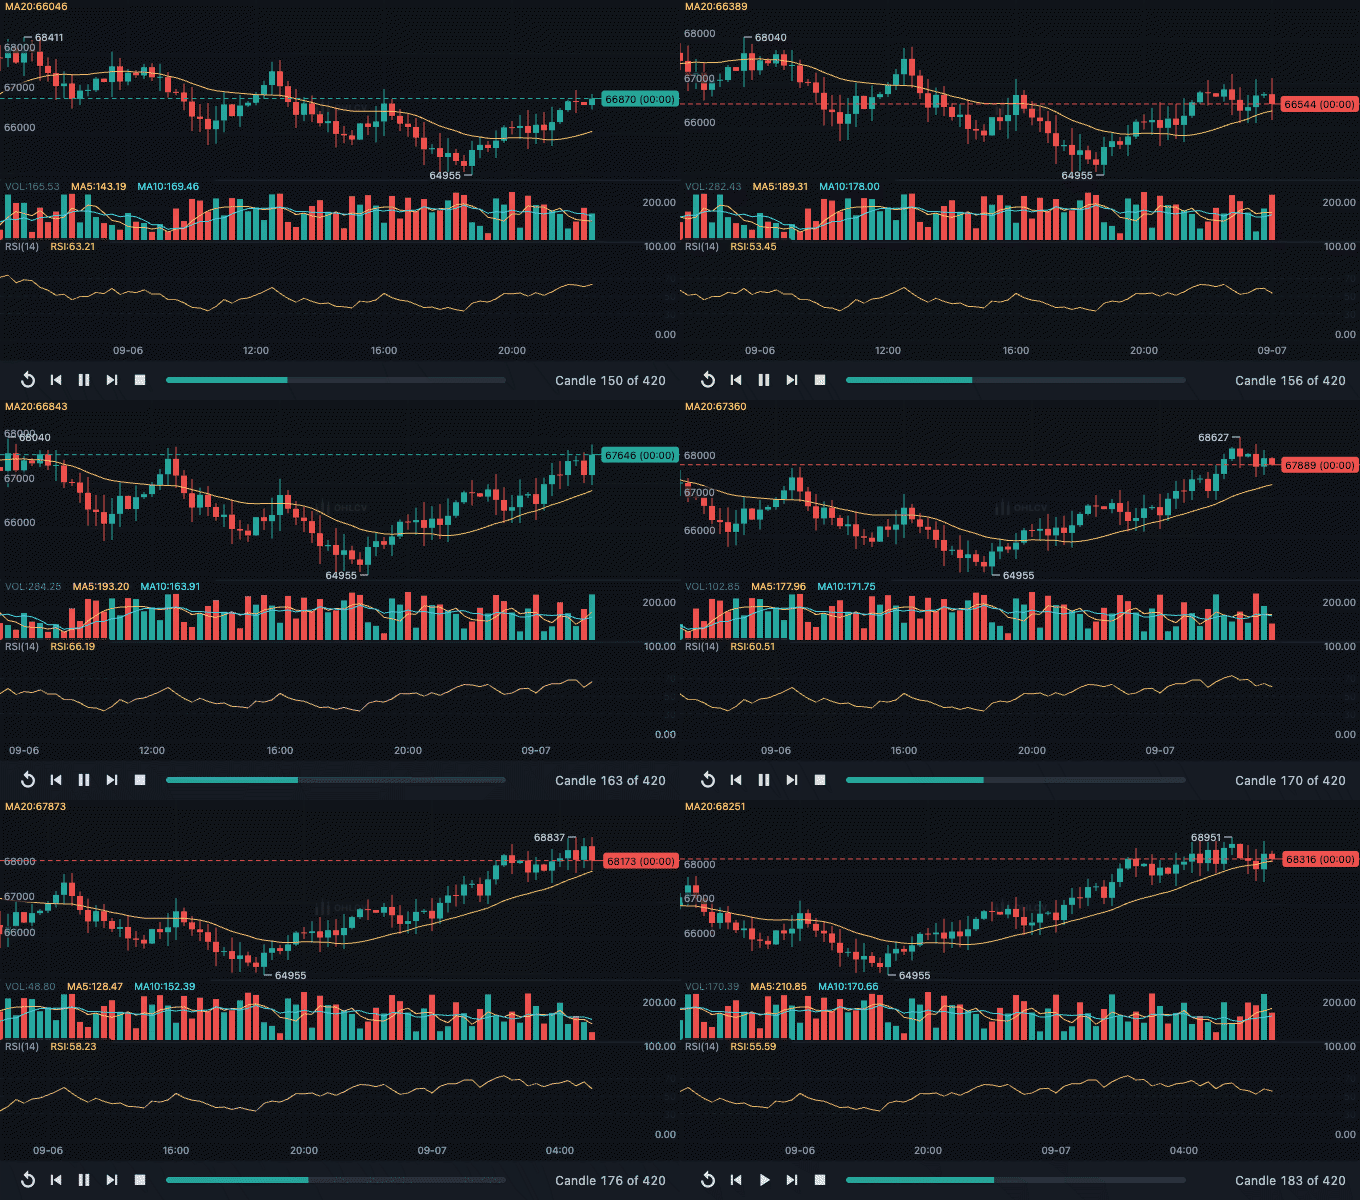 Bar replay Rewind, then step or play forward candle by candle. |
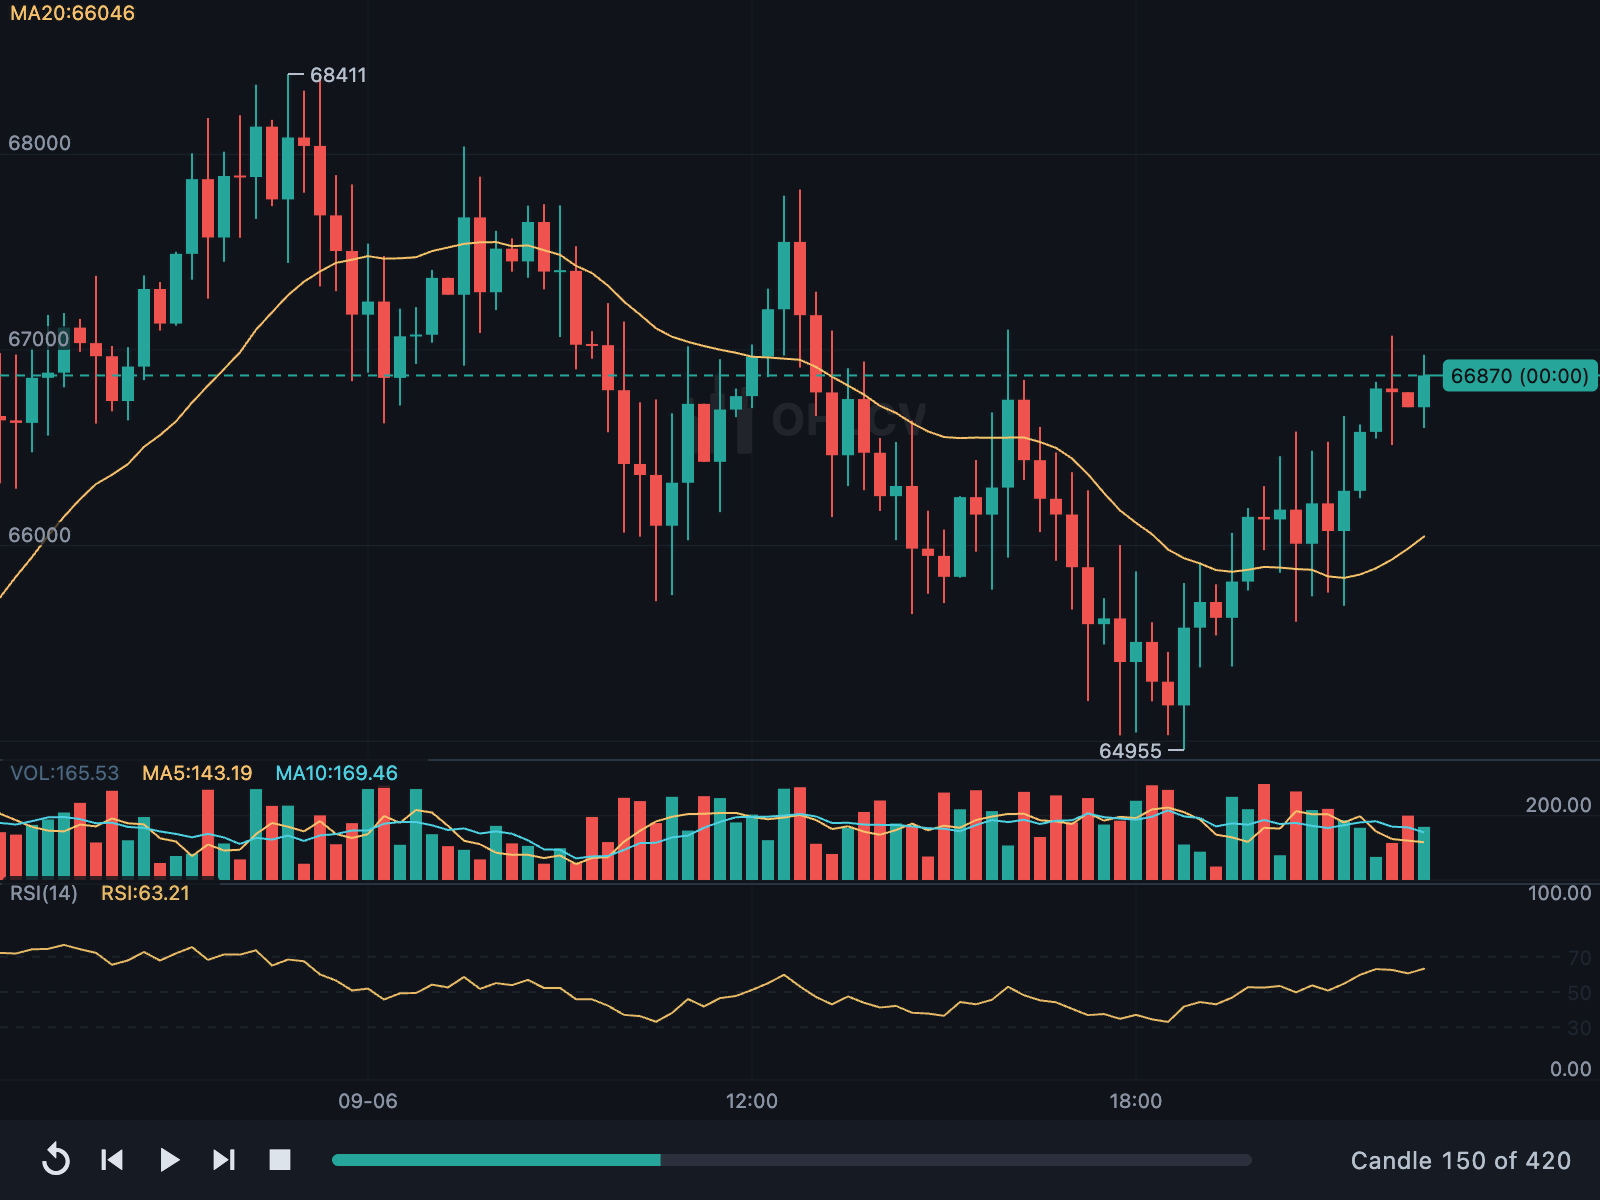 Replay controls Paused at candle 150 of 420, with the playback bar. |
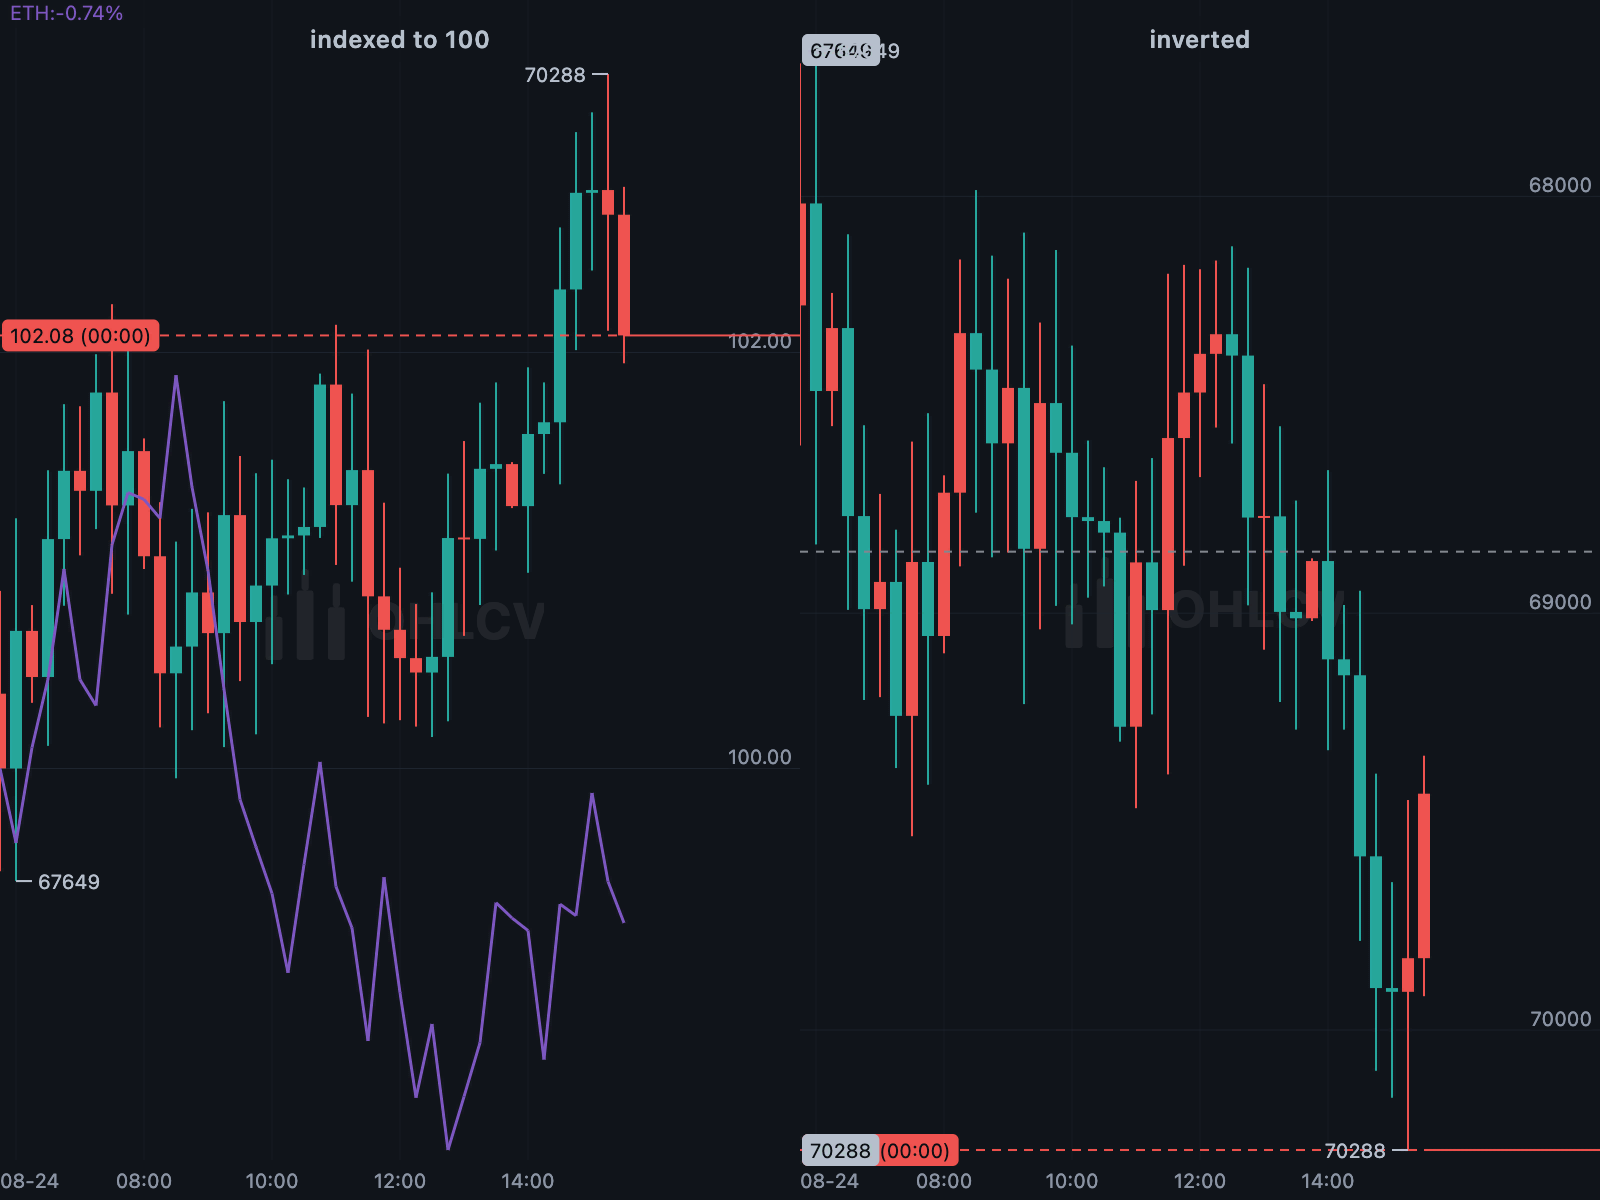 Four price axes Linear, logarithmic, percentage or indexed to 100, and invertible. |
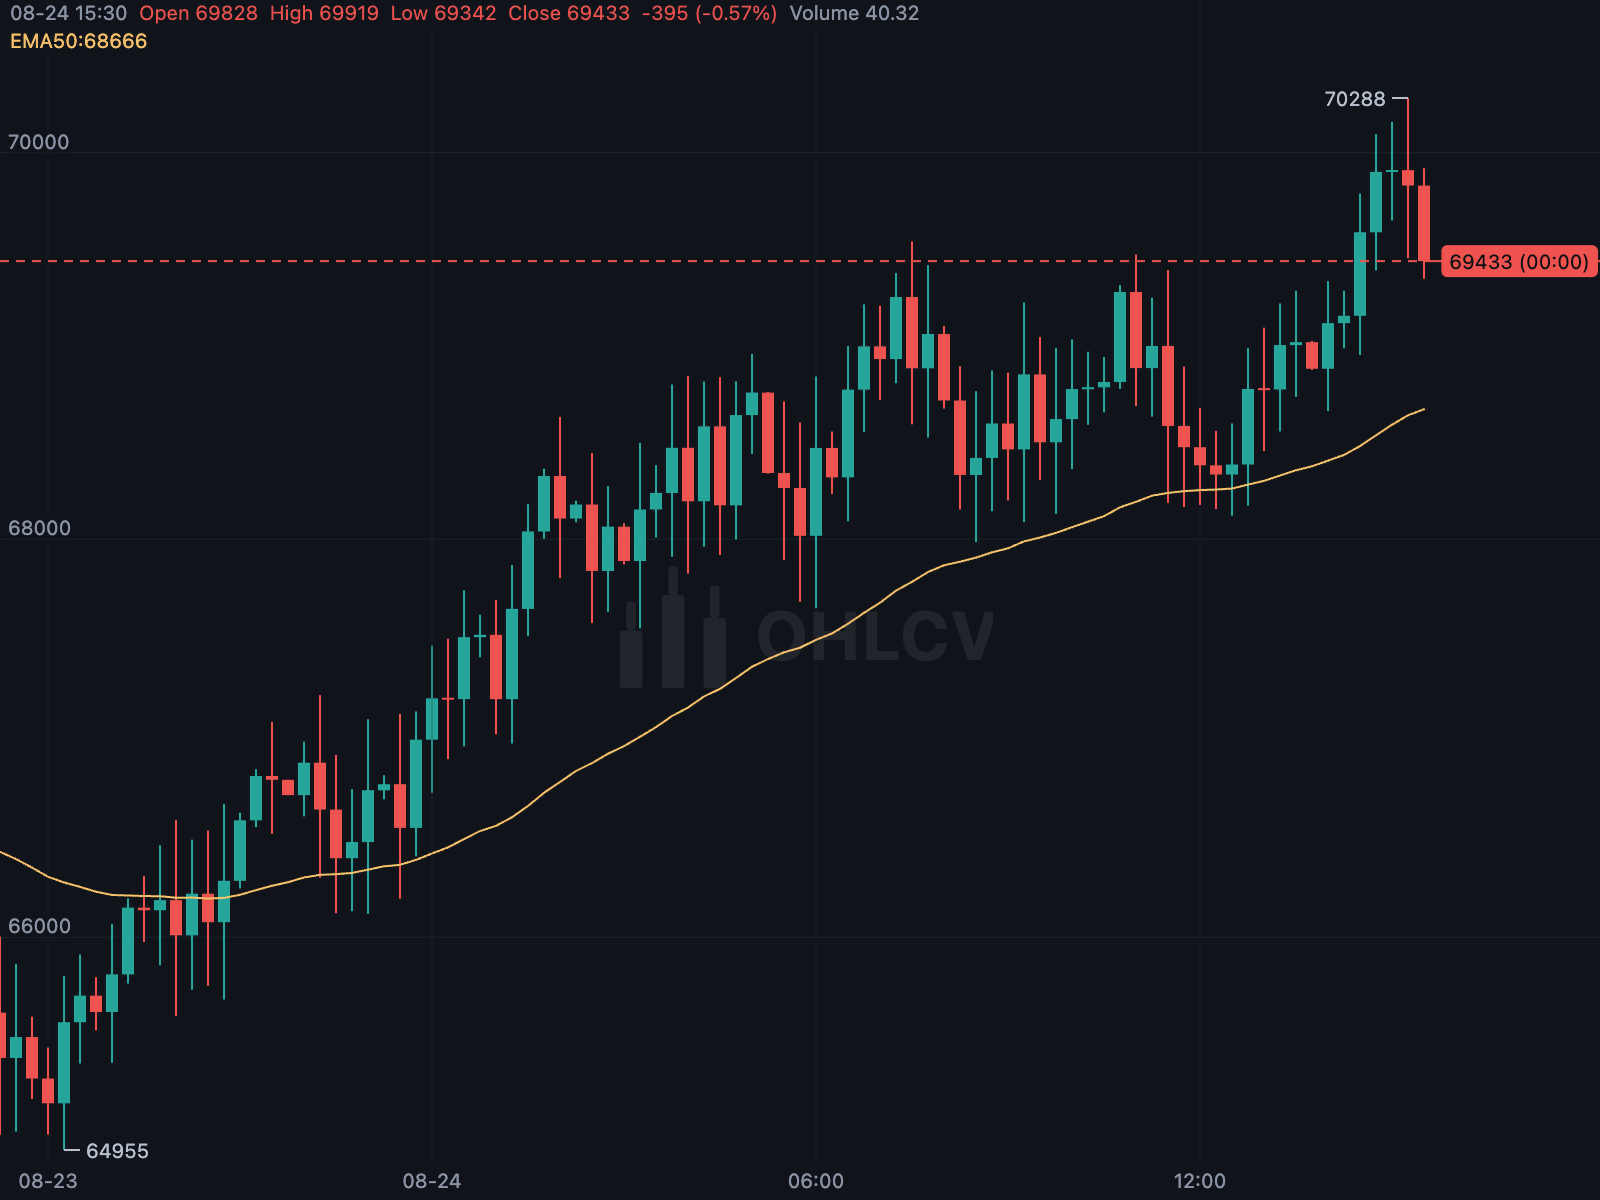 Logarithmic axis Evenly spaced ratios for long-term price history. |
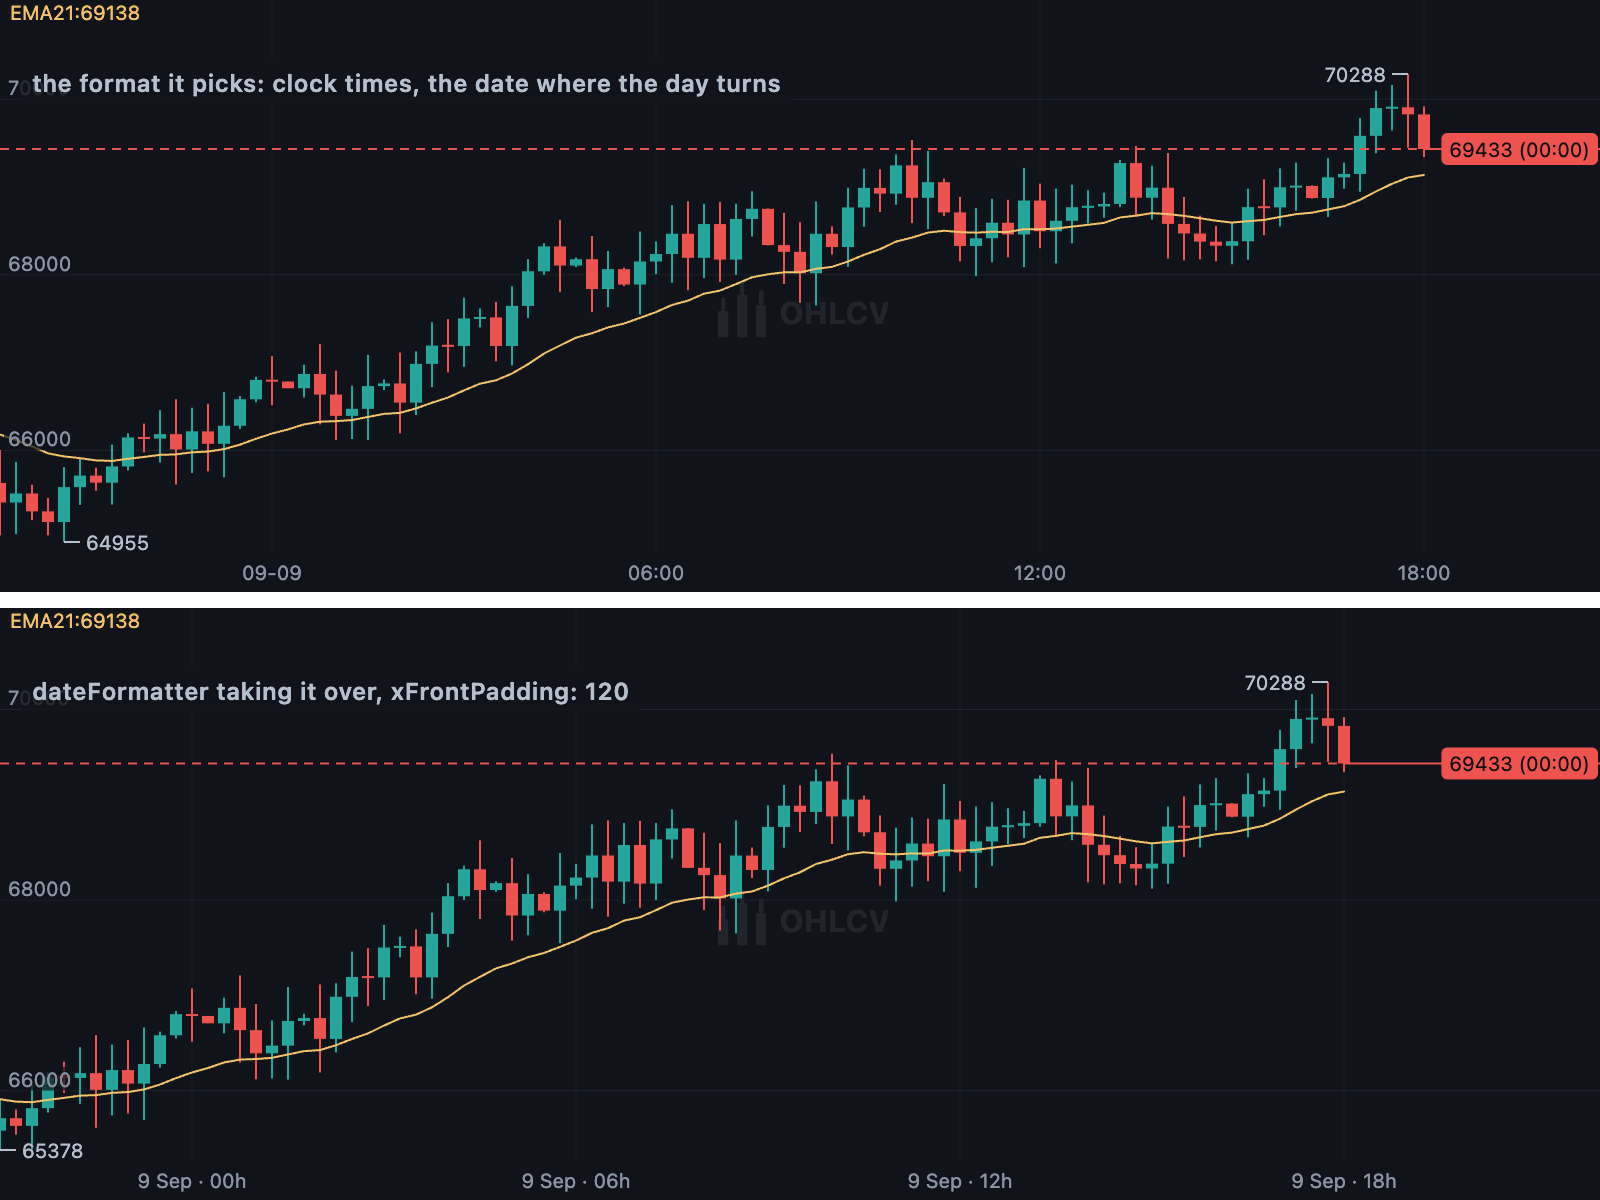 The date axis Automatic round time intervals, or a custom formatter. |
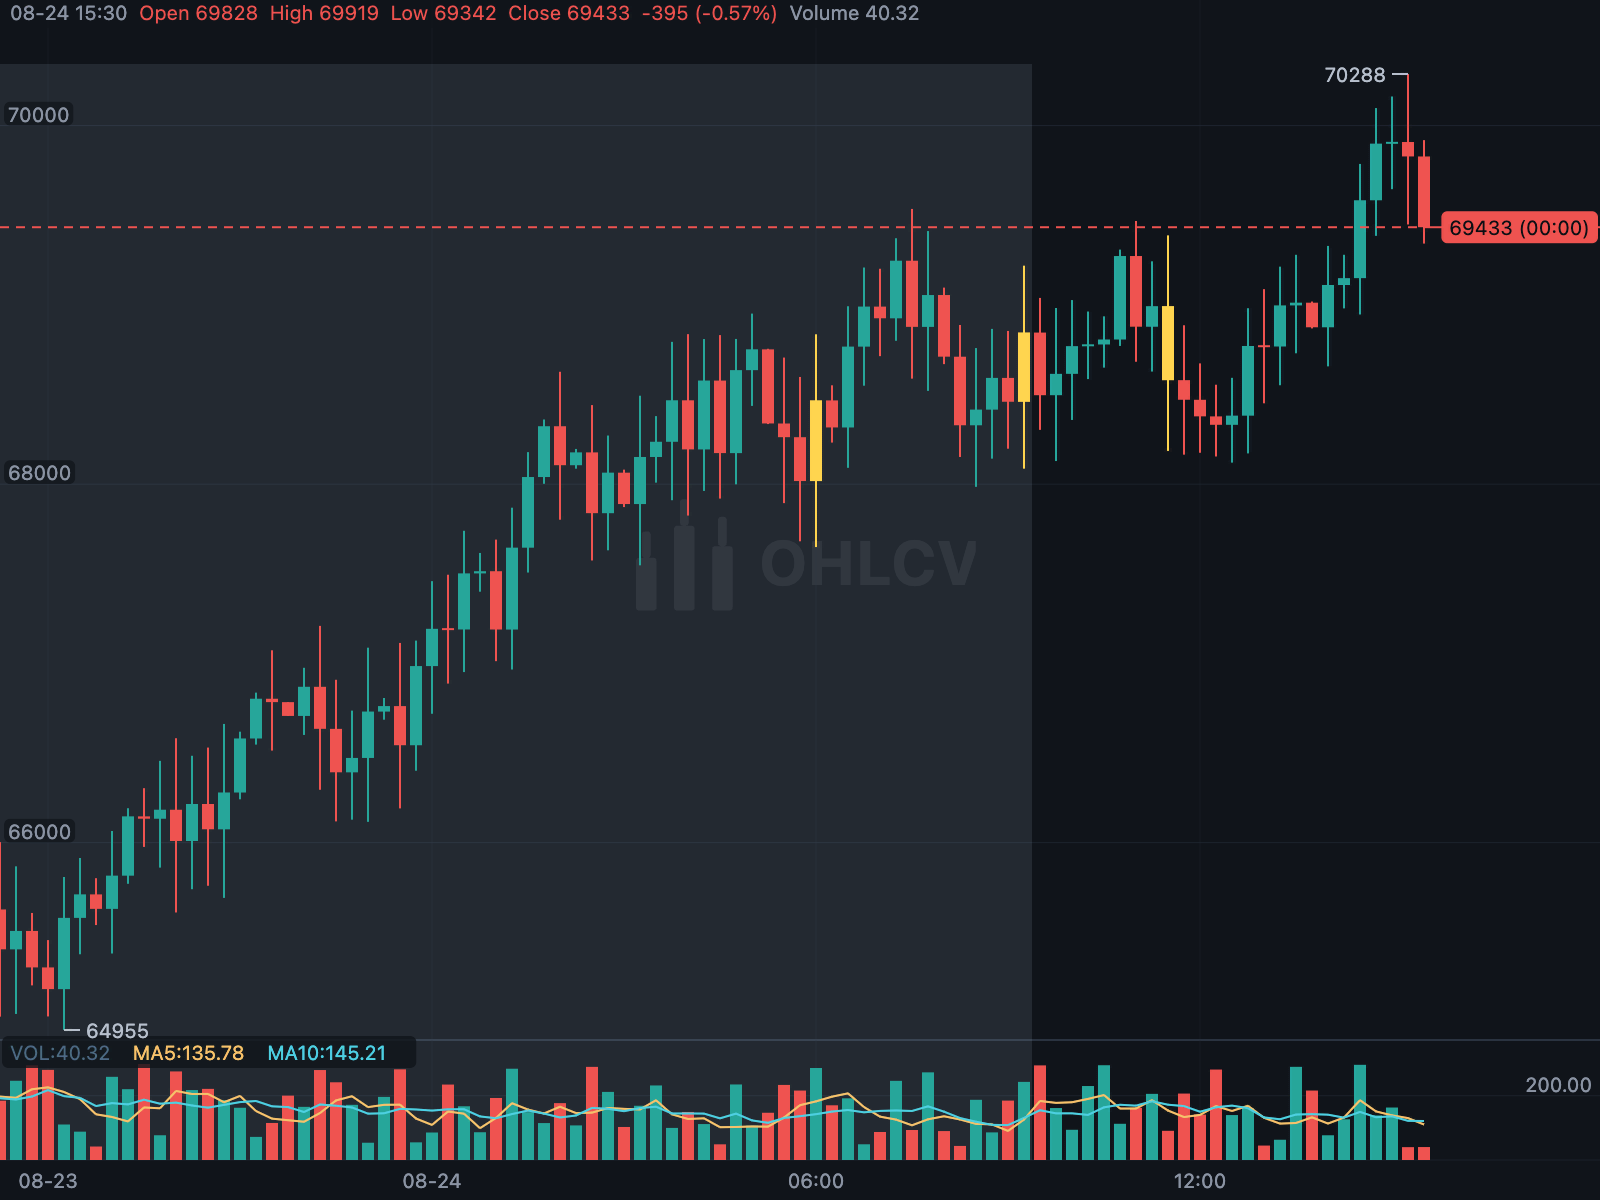 Sessions and time zones Pre-market and after-hours periods shaded behind the candles. |
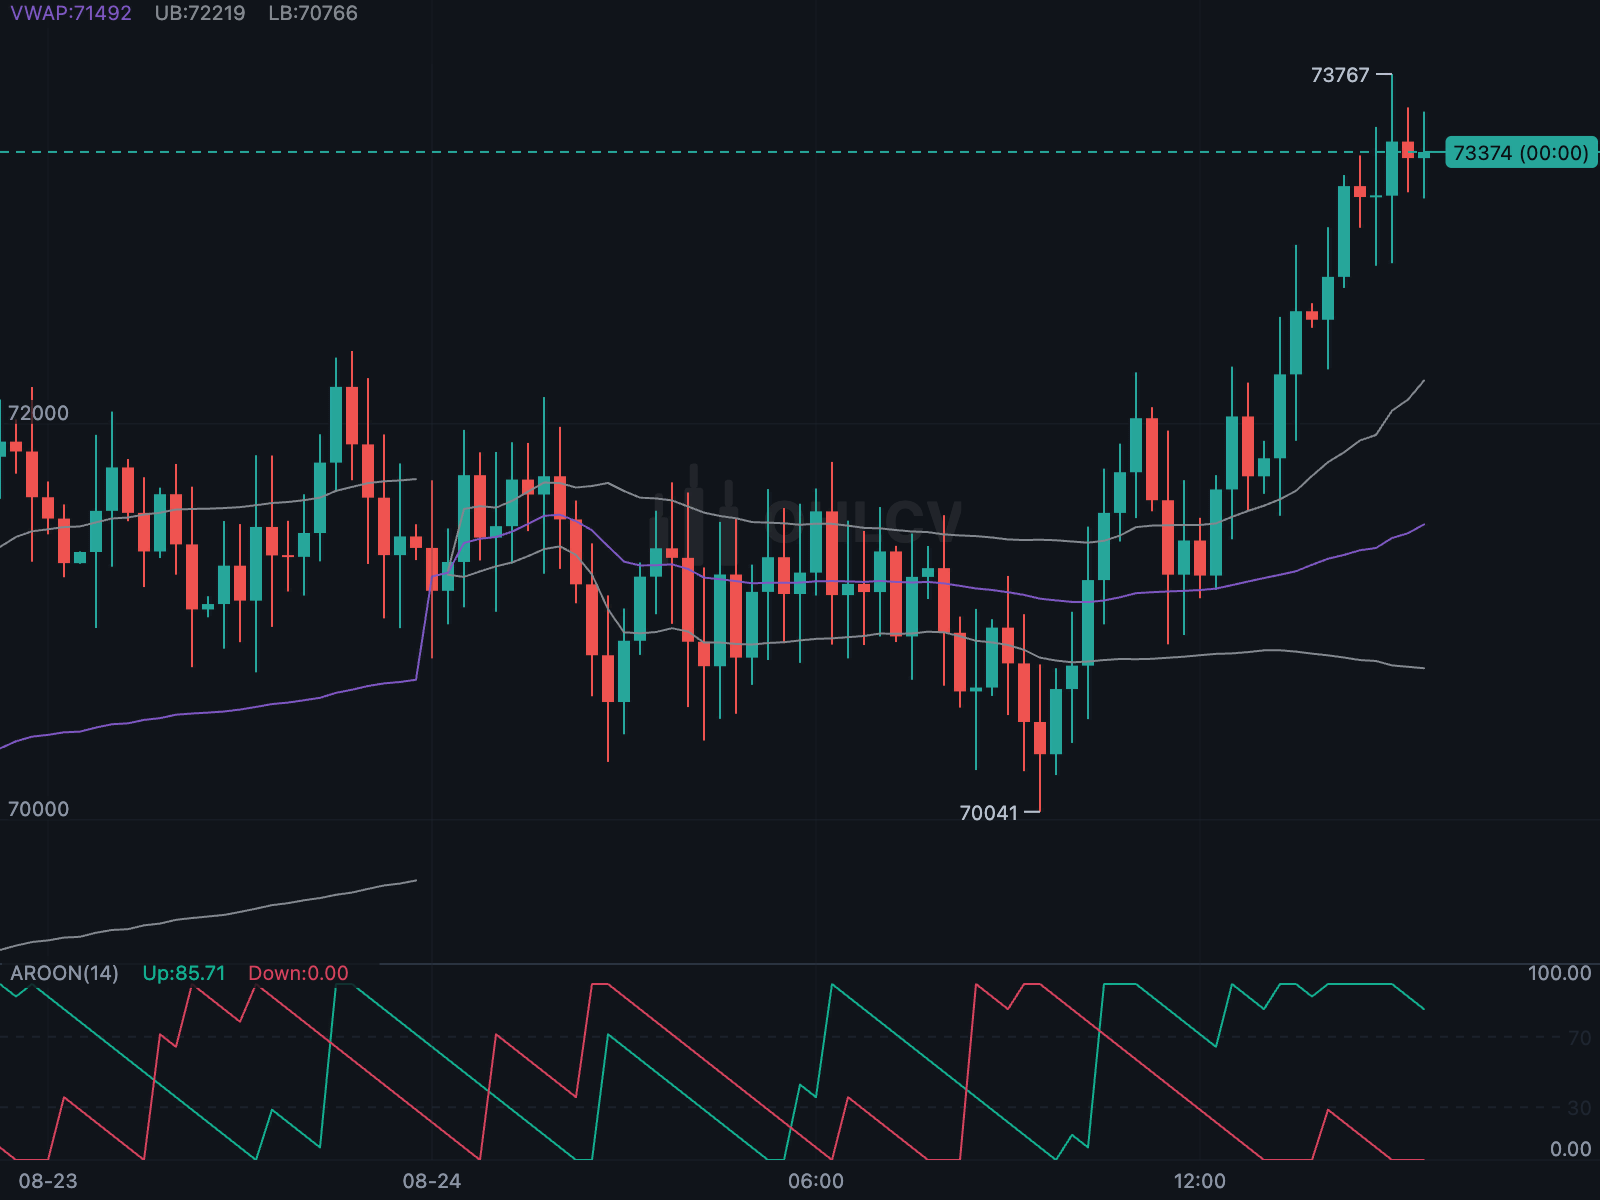 Session VWAP VWAP reset each session, with standard-deviation bands. |
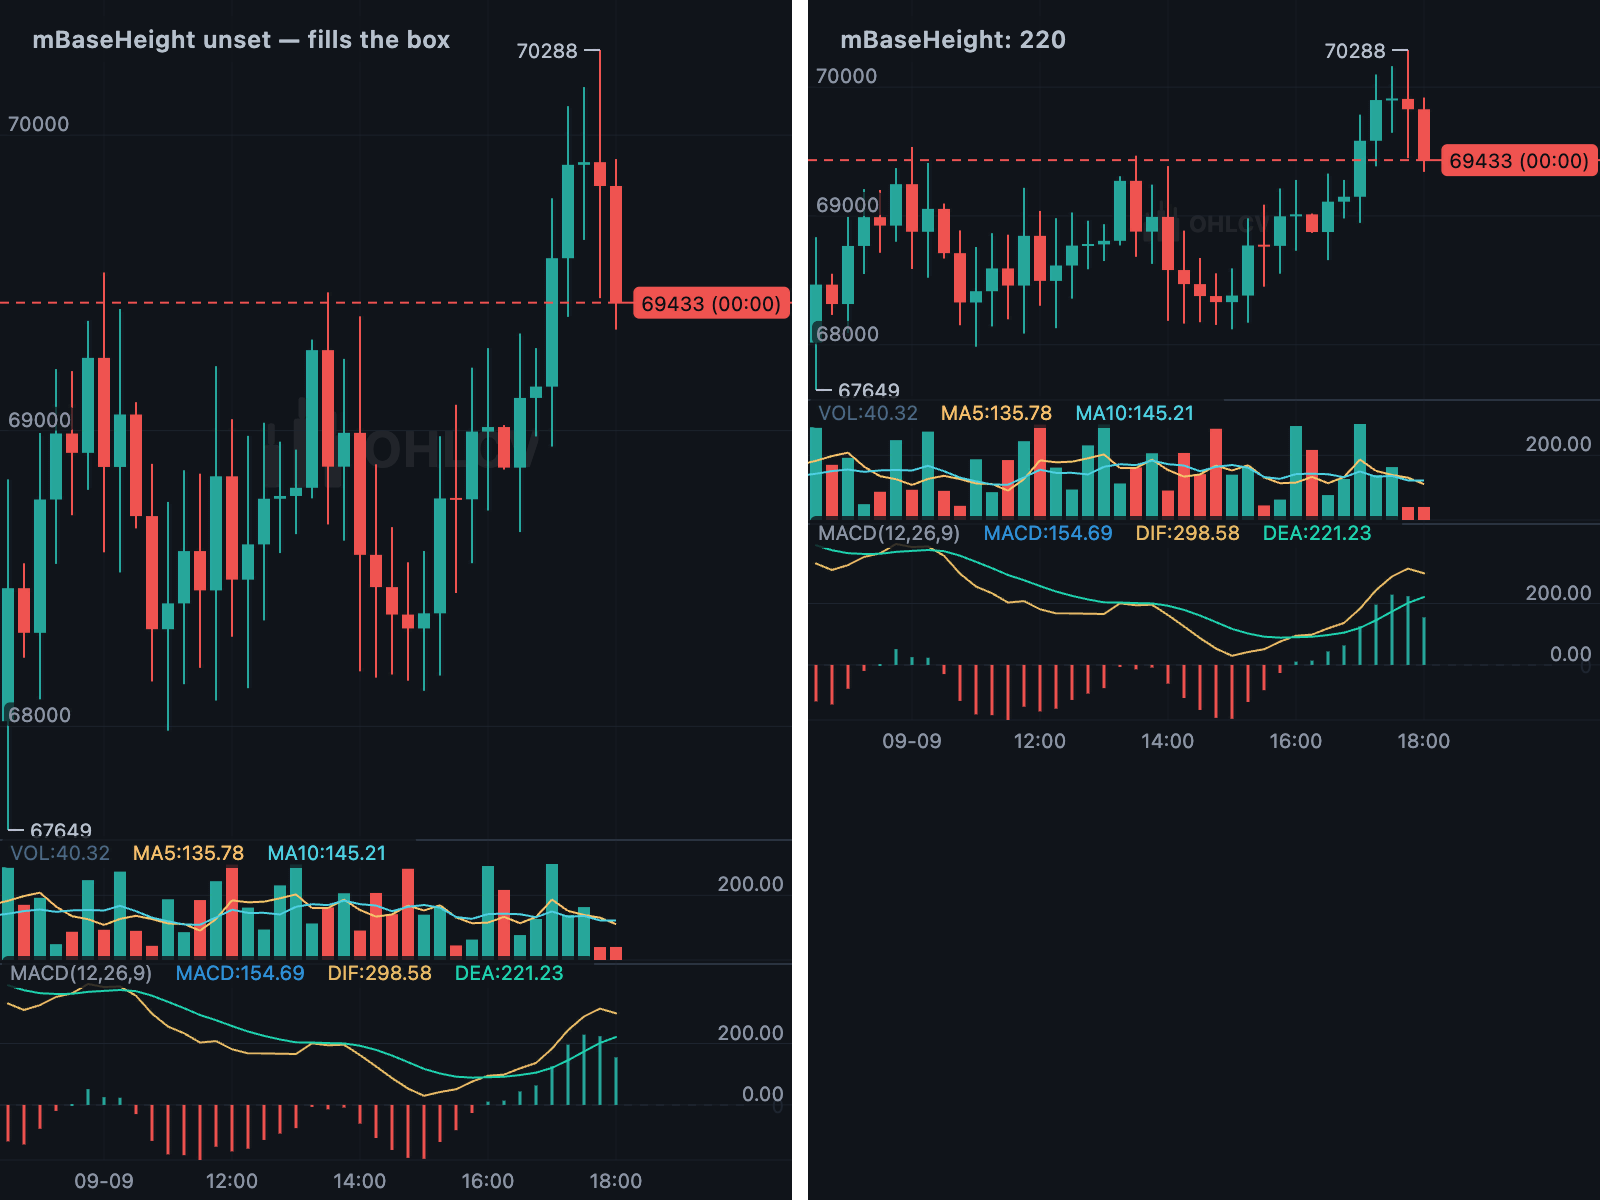 Responsive sizing The candle area filling its container, or set to a fixed height. |
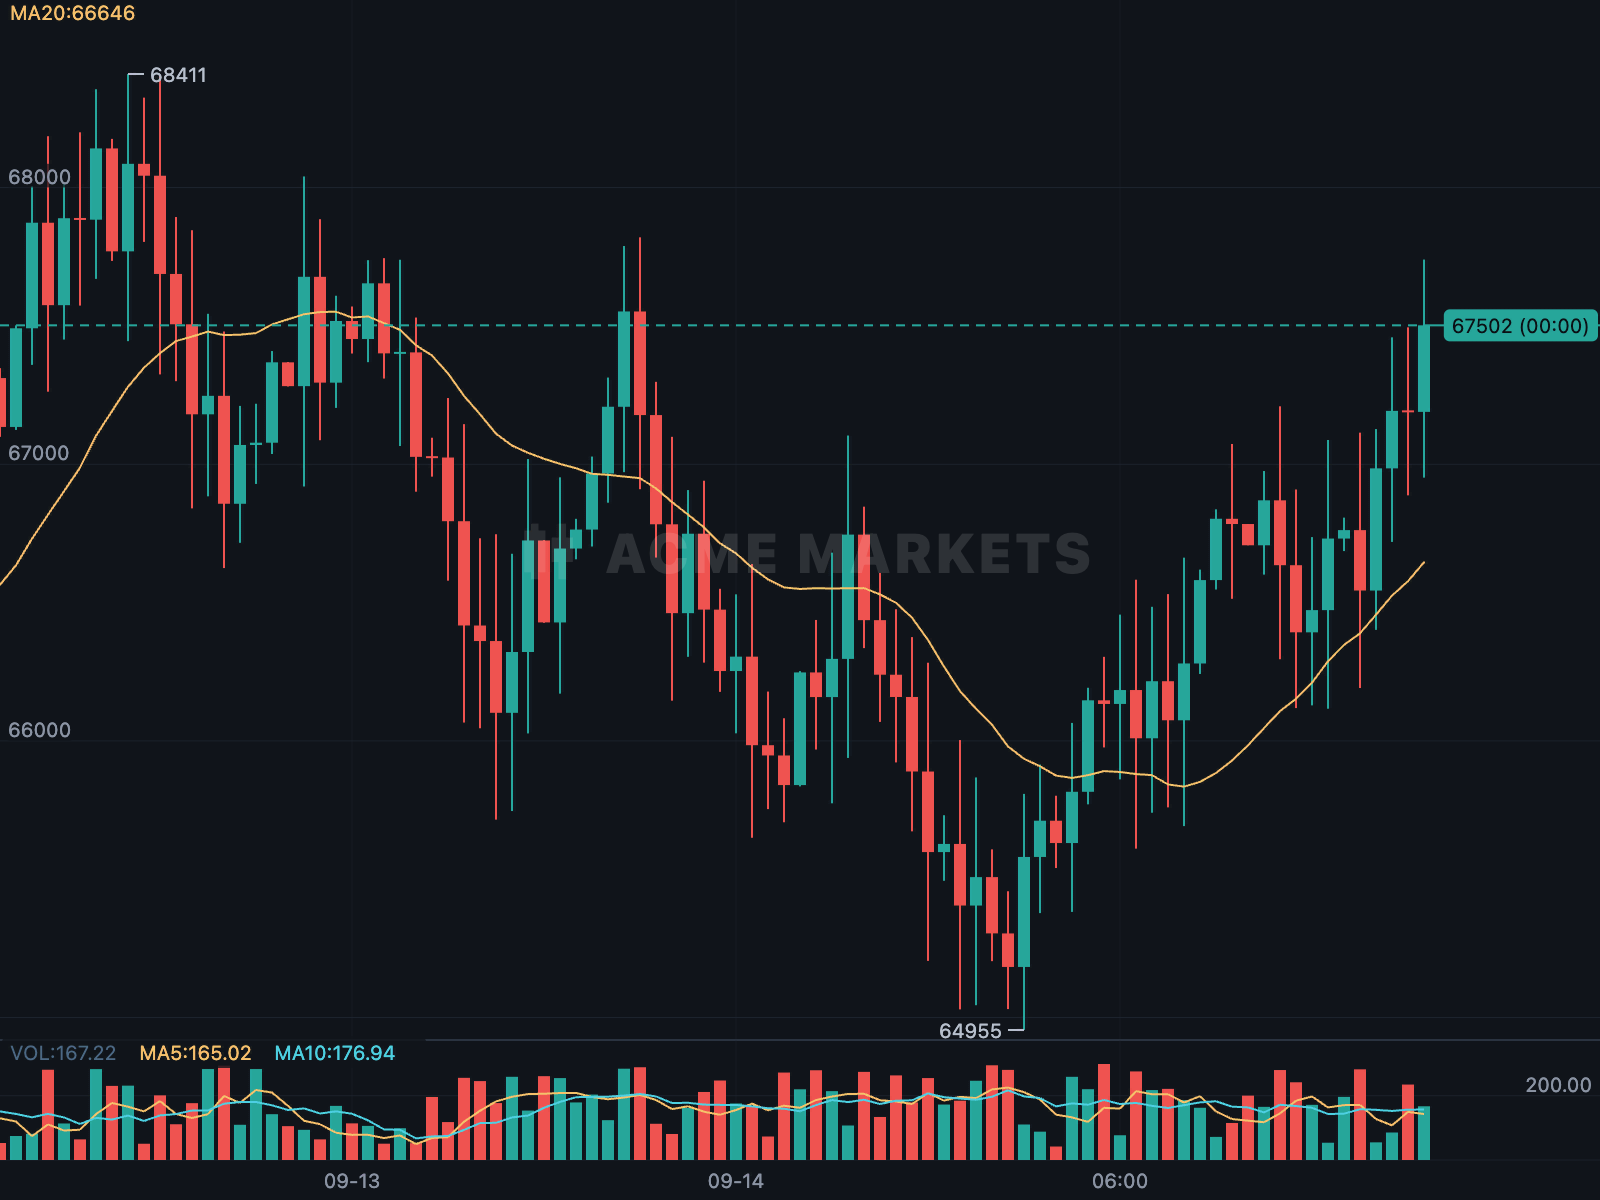 Custom watermark Any widget, rendered faintly over the candle area. |
Back to the documentation index.