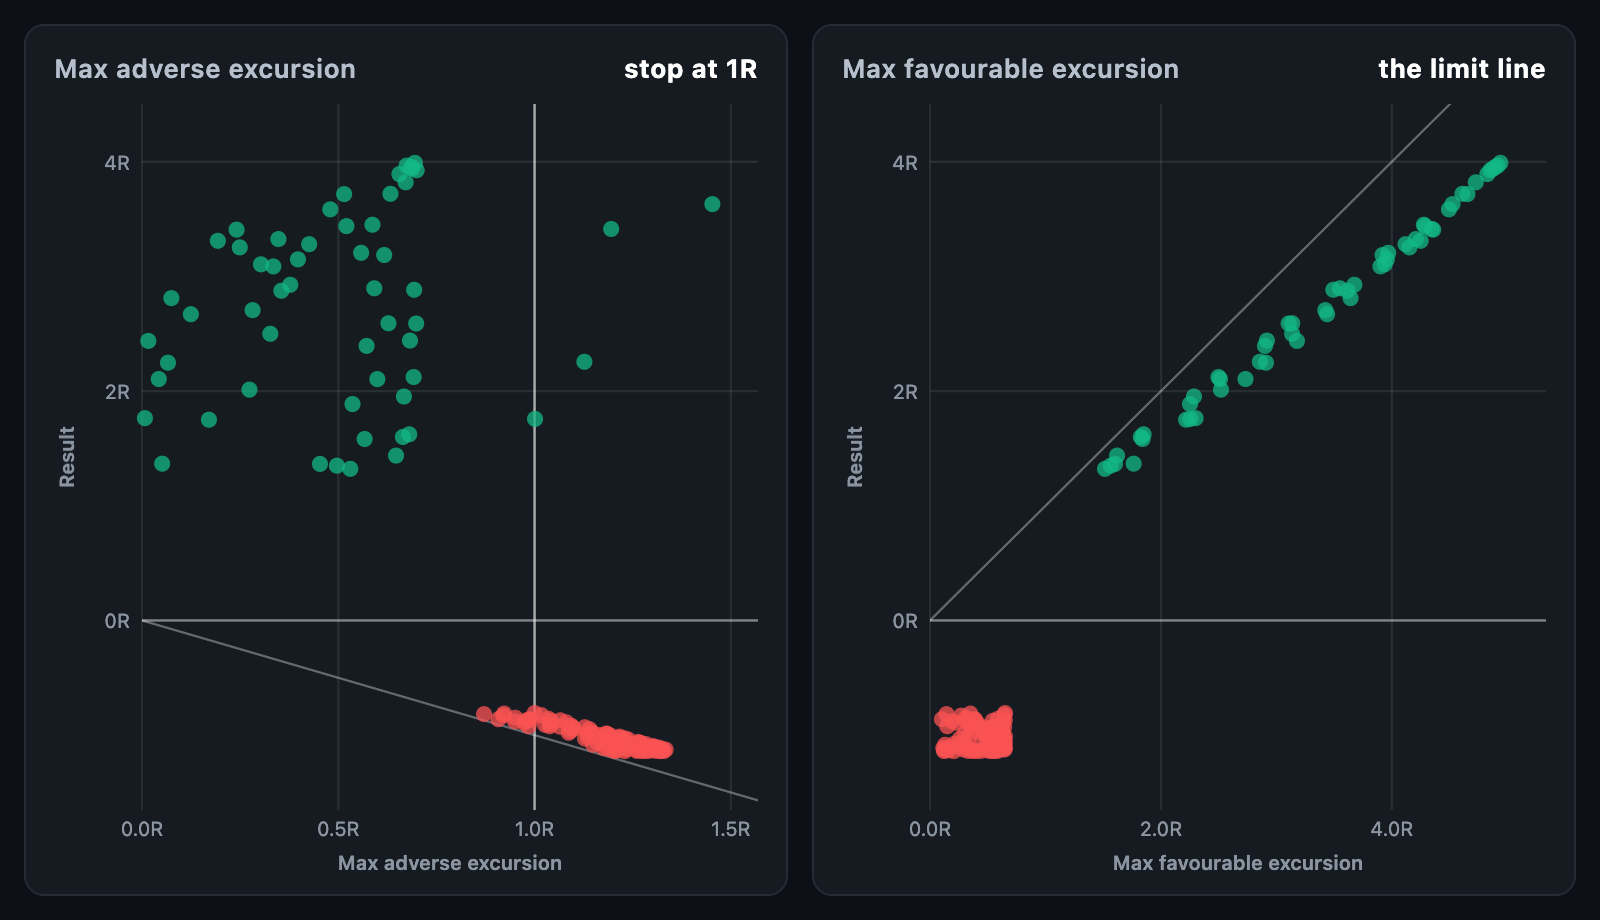
MaeMfeChart puts every trade on a plane by how far it went against you (maximum
adverse excursion, MAE) or for you (maximum favourable excursion, MFE), and what
it finally made. It is the picture system designers use to place a stop and a
target: if few winners ever went deep against the position, a tight stop costs
little.
MaeMfeChart(
  trades: [
    for (final t in backtest.trades)
      TradeExcursion(pnl: t.r, mae: t.maxAdverseR, mfe: t.maxFavourableR),
  ],
  xReferenceLines: const [1], // the stop in use
);
The chart fills its constraints. When the height is unbounded, it uses
defaultHeight.
| Field | Description |
|---|---|
pnl |
What the trade made or lost, in R, points or money |
mae |
How far it went against the position, as a distance of zero or more |
mfe |
How far it went in the position's favour, as a distance of zero or more |
label, color, data |
Name, a colour of its own, and app data returned on touch |
mae, mfe and pnl are all in the same unit.
kind: ExcursionKind.adverse (the default) puts the MAE along the bottom axis.
ExcursionKind.favourable puts the MFE there. Winners and losers take
winnerColor and loserColor.
A line marks the limit no trade can pass: a result never beats its favourable
excursion, nor loses more than its adverse one, so every dot sits on one side
of it. showLimit: false hides it, and showZeroLine marks a result of zero.
xReferenceLines marks excursions such as the stop in use or a target.
| Function | Description |
|---|---|
ExcursionStats.fromTrades(trades) |
Count, winners, losers, average MAE and MFE, and edgeRatio |
winnersStoppedAt(trades, stop) |
How many winners a stop stop away would have taken out first |
excursionRange(trades, kind) |
The ranges the chart would pick |
layOutExcursions(...) / excursionDotAt(...) |
The dots it paints, and a hit test; both usable without a widget |
edgeRatio is the average MFE over the average MAE: above 1 the market moved
more for the positions than against them.
| Parameter | Description |
|---|---|
dotRadius, dotOpacity |
Size of a dot, and how opaque; a crowd shows where it is densest |
limitColor, referenceColor |
Colours of the limit line and the reference lines |
showAxes, axisWidth, axisHeight, tickCount |
The axes and their room |
xFormatter, yFormatter, axisLabelStyle |
Axis labels |
xAxisTitle, yAxisTitle, axisTitleStyle |
Axis titles; the bottom one names the excursion by default |
gridColor |
Grid ruled at each tick; null rules none |
hoverBorder, backgroundColor, padding |
Hover ring, background, space around the chart |
onTouch reports an ExcursionTouchDetails with the dot and its trade, and
null when the pointer leaves. tooltipBuilder builds a card beside the dot.
animationDuration grows the dots in; animationCurve eases it and
animateOnMount controls the first build. The chart animates again only when
the trades' values change, not when the same numbers arrive in a new list.