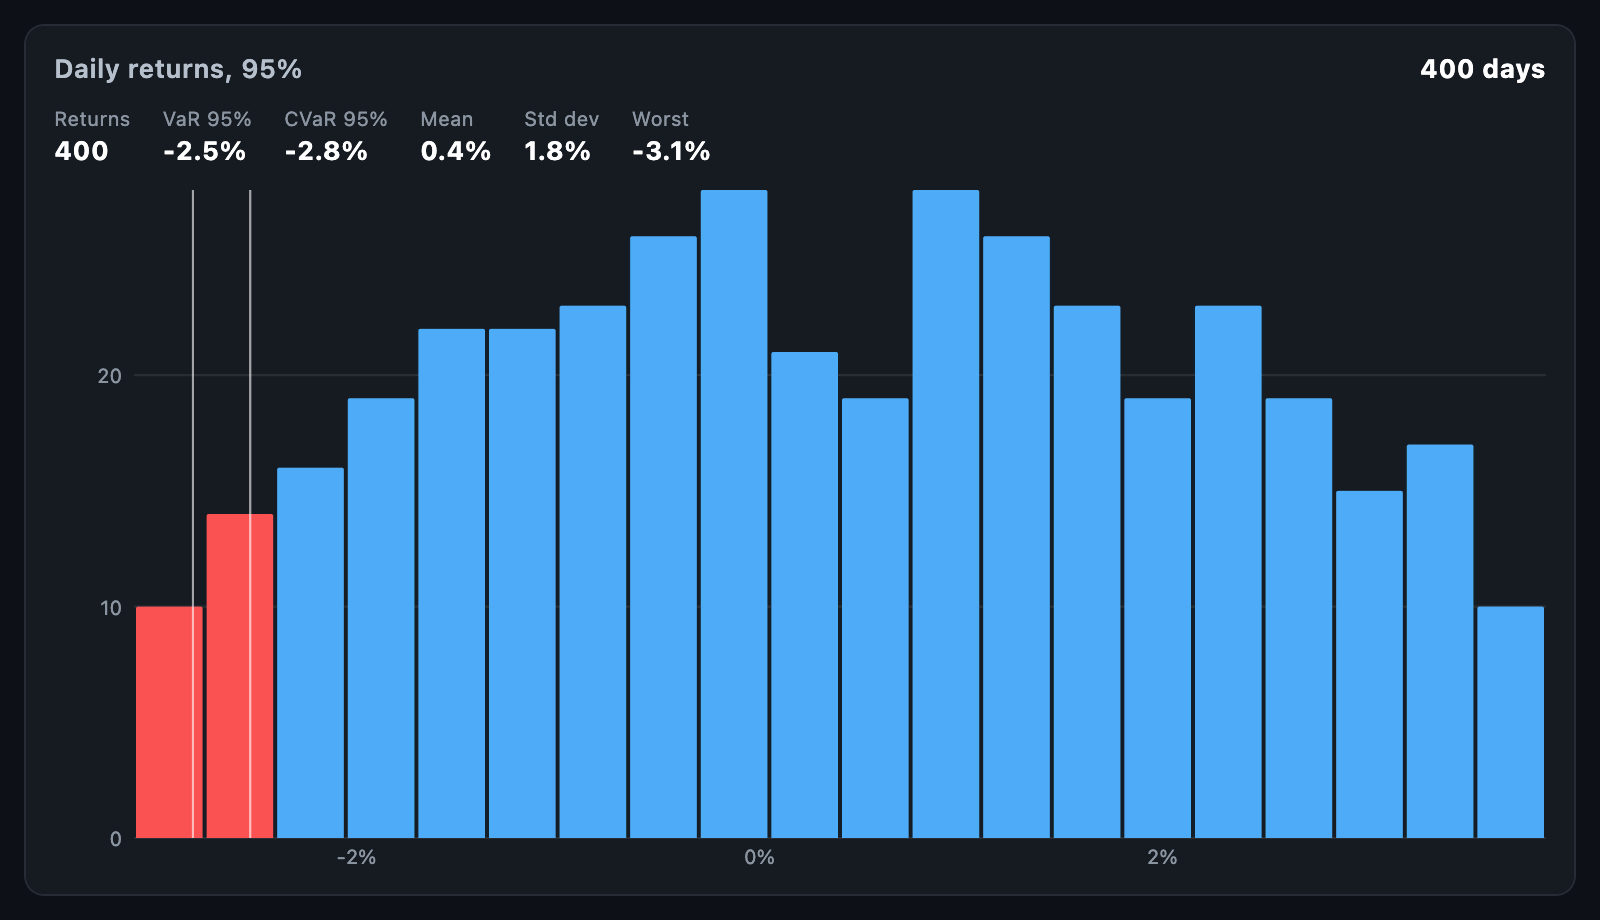
VarChart shows the shape of a set of returns with the loss tail picked out and
two figures marked: value at risk (VaR), the return that only a small share
of outcomes were worse than, and expected shortfall (CVaR), the average of
the outcomes beyond it. Both are worked out from the history itself.
VarChart(returns: dailyReturns, confidence: 0.99);Returns are fractions: -0.03 is a 3% loss. The chart fills its constraints.
When the height is unbounded, it uses defaultHeight; a box too short for the
row of figures shows only the histogram.
ValueAtRisk.fromReturns(returns, confidence: 0.95) returns:
| Field | Description |
|---|---|
valueAtRisk |
The return only 1 - confidence of outcomes fell below; zero or less for a history with losses |
expectedShortfall |
The average of the outcomes at or beyond valueAtRisk; never above it |
mean, standardDeviation |
Average, and the sample standard deviation |
worst, count |
The worst return, and how many there were |
It uses the historical method — no assumption about the shape of returns — with linear interpolation between the two outcomes the threshold falls between. Returns that are not finite are skipped.
varBins(returns, valueAtRisk:, tailColor:) counts the returns into
HistogramBins and colours those in the tail, if you want to hand them to a
HistogramChart of your own.
| Parameter | Description |
|---|---|
confidence |
The share of outcomes VaR is not worse than; 0.95 by default |
binCount, binWidth |
How the histogram is cut; the default is the square root of the count |
barColor, tailColor |
Bars outside and inside the loss tail |
showVarLine, showShortfallLine, showMeanLine |
Which lines mark the figures |
showStats, statsBuilder |
The row of figures, and a builder for your own |
valueFormatter |
Writes a return; the default writes a percentage |
onTouch, tooltipBuilder |
The histogram's touch and card |