
This Zabbix template utilizes the built-in HTTP_AGENT to pull information from the OPNsense API and optimizes API-calls by utilizing dependant-items.
Some checks may only work with OPNsense version >= 25.7
- Only connections over HTTPS
- SSL/TLS verification enabled (
verify_peer&verify_host) - Using Service-User with minimal privileges
-
Gateway Stati
- Gateways High Delay
- Gateways Offline
-
VIP Stati (Virtual IPs)
- VIP - HA Status
-
IPSec Phase-1 Stati
- IPSec Phase-1 Count
-
IPSec Phase-1 Discovery
- IPSec Phase-2 Status
- IPSec Phase-2 Count
- IPSec Phase-2 Status
-
Routes
-
Service Stati
-
System Times
- API connection failed
- Gateways are offline
- Services are inactive
- Gateways have high delays
- VIP HA-State not as expected
- IPSec Tunnels Phase-1 are offline
- IPSec Tunnels Phase-2 are offline
-
Create a new user at
System - Access - Users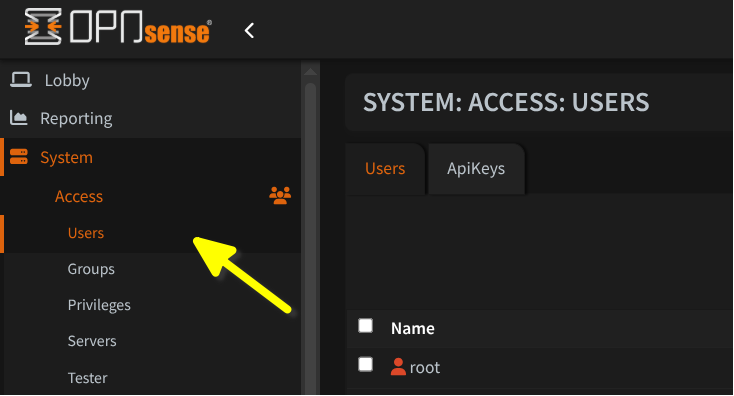
-
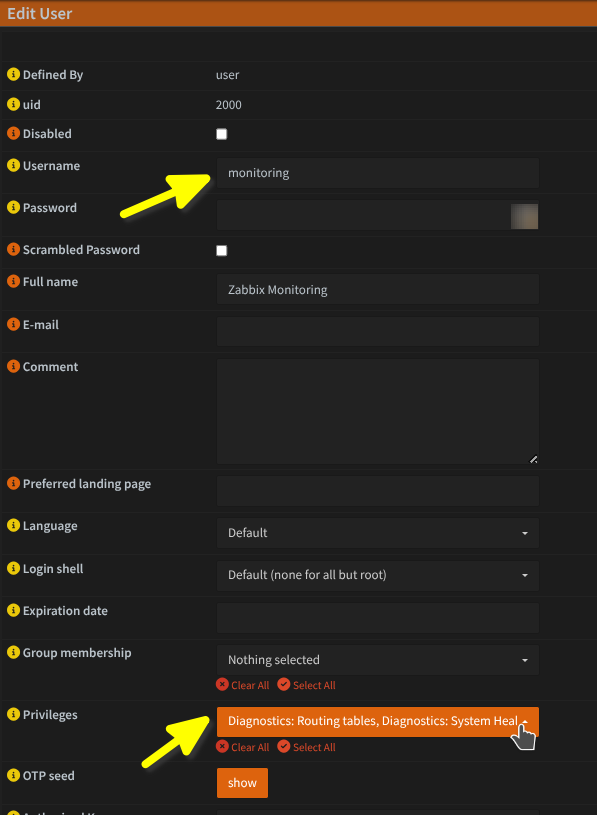
Give the user a name, password and the following privileges:
Lobby: DashboardDiagnostics: Routing tablesInterfaces: Virtual IPs: StatusSystem: Gateways&System: Gateway Groups(sadly, it seems there is no read-only option for the gateways)VPN: WireGuard: Status(Not in use yet)- All with prefix
Status:(Could be limited)
-
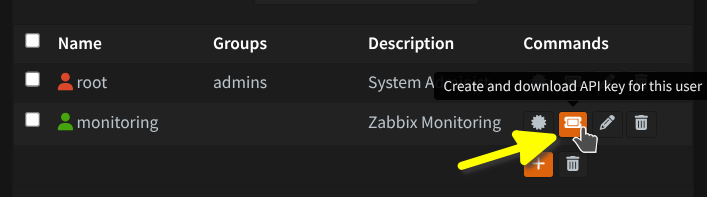
Create and download an API-key for the user
-
Test the access:
If you see a response like this - you may have to increase the permissions:
{"status":403,"message":"Forbidden"}OPN_FIREWALL="IP-or-DNS" OPN_API_KEY="YOUR-KEY" OPN_API_SECRET="YOUR-SECRET" echo "### TESTING SYSTEM-TIMES ###" curl -u "${OPN_API_KEY}:${OPN_API_SECRET}" "https://${OPN_FIREWALL}/api/diagnostics/system/system_time" echo "### TESTING ROUTES ###" curl -u "${OPN_API_KEY}:${OPN_API_SECRET}" "https://${OPN_FIREWALL}/api/diagnostics/interface/get_routes" echo "### TESTING VIRTUAL-IPs ###" # method: "-X POST" curl -u "${OPN_API_KEY}:${OPN_API_SECRET}" "https://${OPN_FIREWALL}/api/diagnostics/interface/get_vip_status" echo "### TESTING IPSec ###" # method: "-X POST" curl -u "${OPN_API_KEY}:${OPN_API_SECRET}" "https://${OPN_FIREWALL}/api/ipsec/sessions/search_phase1" curl -u "${OPN_API_KEY}:${OPN_API_SECRET}" "https://${OPN_FIREWALL}/api/ipsec/sessions/search_phase2" echo "### TESTING SERVICES ###" # method: "-X POST" curl -u "${OPN_API_KEY}:${OPN_API_SECRET}" "https://${OPN_FIREWALL}/api/core/service/search" echo "### TESTING GATEWAYS ###" # method: "-X POST" curl -u "${OPN_API_KEY}:${OPN_API_SECRET}" "https://${OPN_FIREWALL}/api/routing/settings/search_gateway"
The Zabbix-Server or -Proxy you choose to monitor the firewall-hosts with, has to be able to connect to the firewall's Web-UI.
-
Import the YAML Template into your Zabbix Server
-
Link the template to a Firewall-Host
-
Configure the required host-macros:
{$OPN_FIREWALL}=> the IP or DNS of the firewall as configured for the Web-UI (can include a port){$OPN_API_KEY}=> the generated API-key{$OPN_API_SECRET}=> the generated API-secret
-
Configure optional host-macros:
{$OPN_HA_STATE_EXPECT}=> the HA-state to be expected: 'standalone', 'primary' or 'secondary' (default = standalone){$OPN_IPSEC_P1_EXPECT}=> number of IPSec-phase-1 connections to expect{$OPN_IPSEC_P2_EXPECT}=> number of IPSec-phase-2 connections to expect