Every control the library supports: its settings, the values it sends to the Dash app, and what its callbacks receive when the app changes it. How a control looks is set by its settings in code, or by a layout made in the app (layouts.md).
- A control is identified by its type and ID. The ID is at most 7 characters, to keep messages short, and unique among the device's controls of that type. A longer ID raises
ValueError, in code and in loaded layouts. - Add each control to the device with
device.add_control(control). Controls in a loaded layout are created for you (layouts.md). - Settings are the constructor's parameters: the control's title, position, colours, range and so on. They go into the layout the device generates from its controls.
- Values are properties, such as
dial.dial_value. Setting one sends it to every connected app. The device keeps the latest values, and sends them all when an app connects. - Numbers are sent to fit the control. Dial and Table, which have a precision setting, send 6 significant digits, and the app shows them to the precision, which the user can change. Precision is the number of significant digits shown: 62.37 shows as 60 with
Precision.ONE, 62 withTWOand 62.4 withTHREE. Other controls send 5 significant digits. - Setting a value to
Nonesends "not available": the app shows the control greyed out, e.g. when a sensor has failed. Dial, Direction, Knob and Slider also haveis_active:Falsegreys the control out, and setting a value makes it active again. - When the user changes a control, the callbacks added with
add_receive_message_callback(callback)are called with the message from the app, split on tabs:msg[0]is the device ID,msg[1]the control type,msg[2]the control ID, andmsg[3]the value, as text. Send the new value back from the callback: that tells the app the device took the change, and shows it in every other app connected to the device. A callback can also return a string, which the device sends as a reply.
Most controls take these settings:
| Parameter | Default | |
|---|---|---|
control_id |
The control's ID, up to 7 characters | |
title |
Depends on the control | Shown with the control |
title_position |
TitlePosition.BOTTOM |
TOP, TOPLEFT, BOTTOM or NONE |
control_position |
None | ControlPosition(x, y, width, height): where it is on its DeviceView, as fractions of the DeviceView's width and height. Needed for the generated layout |
| Control method | |
|---|---|
add_receive_message_callback(callback) |
Calls callback(msg) when the app sends the control a message |
remove_receive_message_callback(callback) |
Stops calling it |
add_config(ControlConfig) |
Shows the control a second time in the generated layout, e.g. on another DeviceView, with its own title and position |
parent_id |
The DeviceView, Menu or ButtonGroup it's on. Set by their add_control() |
from_cfg_dict(cfg_dict) |
Creates the control from its entry in a decoded layout |
| Control | Set its value | Its callbacks receive in msg[3] |
|---|---|---|
| Button | btn_state, text, icon_name, send_button() |
Nothing: a tap |
| Knob | knob_value, knob_dial_value |
The knob's position |
| Slider | slider_value, bar1_value, bar2_value |
The slider's position |
| Selector | position, set_selected(), send_selection() |
The selected index, from 0 |
| TextBox | text, color, caption, caption_color |
The text the user entered |
| ColorPicker | color_value, send_color_rgb() |
The colour, e.g. #23A89F |
| Dial | dial_value |
|
| Direction | direction_value, direction_text |
|
| TimeGraph | add_data_point() on its lines |
|
| EventLog | add_event_data() |
|
| Map | add_location_to_track() |
|
| Chart | its lines' data, send_chart() |
|
| Table | add_table_row(), update_table_row() |
|
| AudioVisualDisplay | url |
|
| Alarm | send() |
|
| Menu, ButtonGroup | Nothing: they show other controls | Nothing: opened |
| Label, DeviceView | Nothing: layout only |
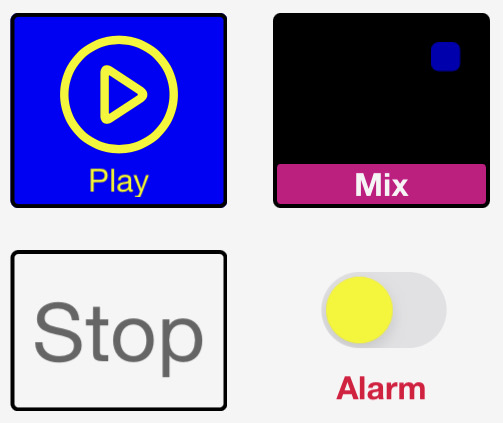
pump = dashio.Button("pump", "Pump", control_position=dashio.ControlPosition(0.1, 0.1, 0.3, 0.2))
device.add_control(pump)


def pump_tapped(msg):
    pump.toggle_btn()


pump.add_receive_message_callback(pump_tapped)
pump.send_button(dashio.ButtonState.ON, dashio.Icon.PLAY, "Running")- A tap doesn't change the button in the app. Your callback decides what a tap means, and sets the button's state to show it: the button is both an input and a status indicator.
btn_stateisButtonState.ON,OFForFLASH.textandicon_namechange its text and icon.send_button(btn_state, btn_icon, text)sets all three.toggle_btn()switches between on and off.
| Parameter | Default | |
|---|---|---|
title |
"A Button" |
|
button_enabled |
True | False stops the app sending taps |
style |
ButtonStyle.BASIC |
Or HIGHLIGHT |
icon_name |
Icon.NONE |
|
on_color, off_color |
Color.BLUE, Color.RED |
|
text |
"" |
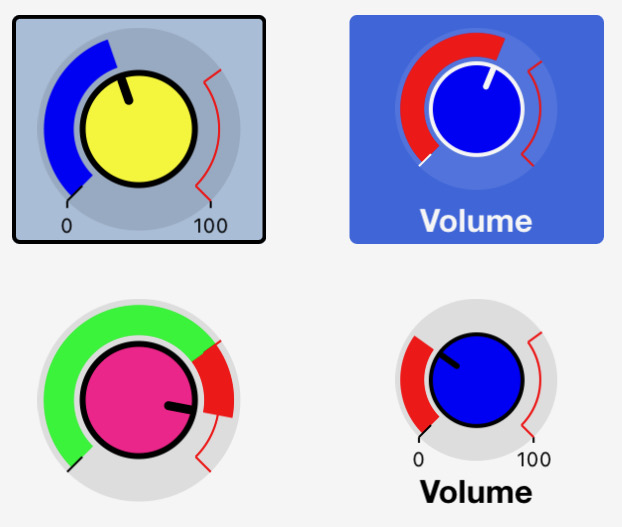
volume = dashio.Knob("vol", "Volume", dial_max=10.0, control_position=dashio.ControlPosition(0.1, 0.4, 0.4, 0.3))
device.add_control(volume)


def volume_changed(msg):
    volume.knob_value = float(msg[3])


volume.add_receive_message_callback(volume_changed)
A knob the user turns, inside a dial. knob_value sets the knob, and knob_dial_value the dial, e.g. to show the value actually reached.
| Parameter | Default | |
|---|---|---|
title |
"A Knob" |
|
knob_style |
KnobStyle.NORMAL |
Or PAN |
dial_min, dial_max |
0.0, 100.0 | The range |
red_value |
75.0 | Where the dial turns red |
show_min_max |
False | |
send_only_on_release |
True | False sends values while the knob turns |
dial_mode |
DialMode.FOLLOW |
The dial follows the knob. MSG: the dial only shows knob_dial_value |
dial_color, knob_color |
Color.BLUE, Color.RED |
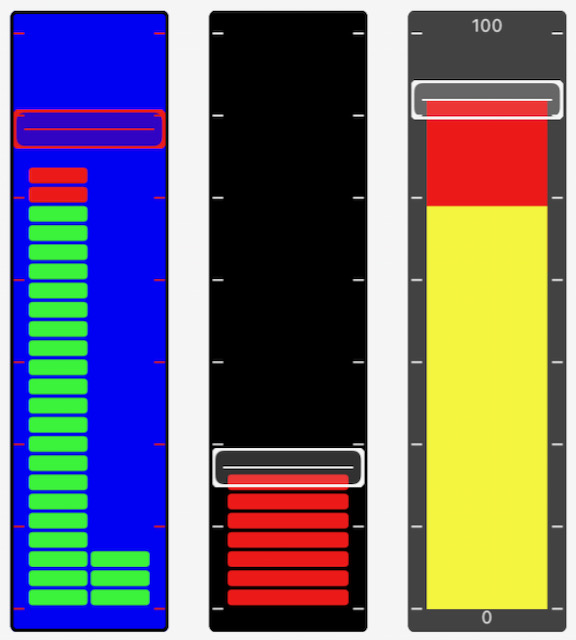
A slider the user moves, beside a bar the device sets. slider_value sets the slider, and bar1_value the bar, e.g. to show the value reached. Set bar2_value to show a second bar. With slider_enabled=False it's a bar graph the user can't move.
| Parameter | Default | |
|---|---|---|
title |
"A Single Slider" |
|
bar_min, bar_max |
0.0, 1000.0 | The range |
red_value |
750 | Where the bar turns red |
show_min_max |
False | |
slider_enabled |
True | False hides the slider, leaving the bar |
send_only_on_release |
True | False sends values while the slider moves |
bar_mode |
BarMode.FOLLOW |
The bar follows the slider. MSG: the bar only shows bar1_value |
bar_color, knob_color |
Color.BLUE, Color.RED |
|
bar_style |
SliderBarStyle.SEG |
Or SOLID |
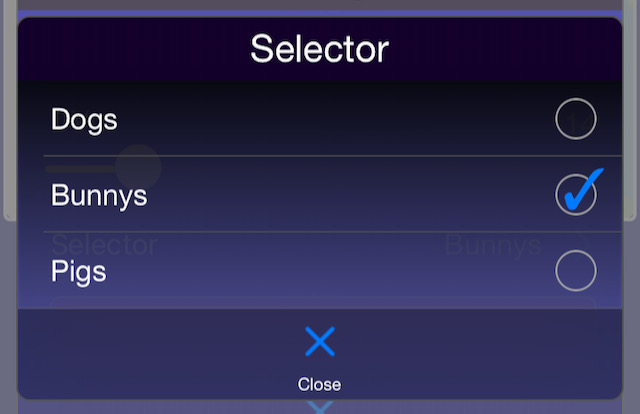
mode = dashio.Selector("mode", "Mode", selection=["Off", "Auto", "On"], control_position=dashio.ControlPosition(0.1, 0.8, 0.4, 0.1))
device.add_control(mode)


def mode_selected(msg):
    mode.position = int(msg[3])


mode.add_receive_message_callback(mode_selected)
The user picks from a list. The app sends the index of the choice, and shows it as selected once the device sets position.
| Method or value | |
|---|---|
selection (parameter) |
The list of choices |
add_selection(text) |
Adds a choice, and returns its index |
position |
The selected index. Setting it sends it |
set_selected(text) |
Selects a choice by its text |
send_selection(position=None) |
Sends the list of choices, and optionally a new position |
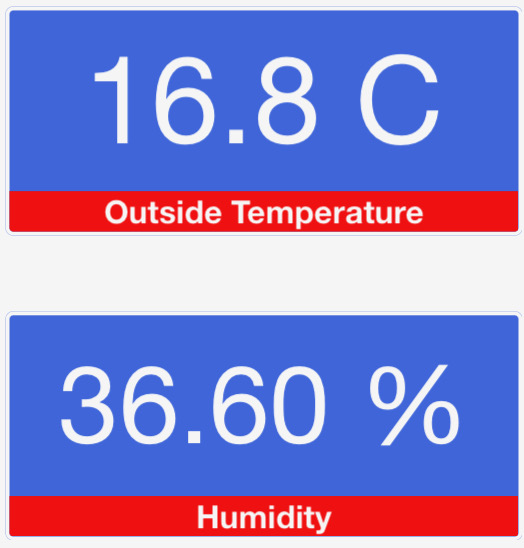
Shows text, a number or a date and time from the device, and lets the user enter text with the keyboard you choose. The app sends the text when the user taps Send.
textsets the text, andcolorits colour (Color.WHITEuntil set).captionandcaption_colorset the caption, a smaller line under the text.
| Parameter | Default | |
|---|---|---|
title |
"A Text Box" |
|
text |
"" |
|
text_align |
TextAlignment.LEFT |
Or CENTER, RIGHT |
text_format |
TextFormat.NONE |
NUM formats a number, DATETIME and DTLONG an ISO 8601 date and time, INTVL an interval, SUBS substitutes text (see replace), or LOG |
units |
"" |
|
precision |
Precision.OFF |
|
keyboard_type |
Keyboard.ALL |
NONE (display only), NUM, INT, HEX, DATE, TIME, DATETIME or INTVL |
close_keyboard_on_send |
True | |
caption_mode |
CaptionMode.MSG |
The caption shows caption. SENT: it shows the last text the user sent |
replace |
None | For TextFormat.SUBS: each key in the text is shown as its value, e.g. {"0": "OK", "1": "Fault"} |
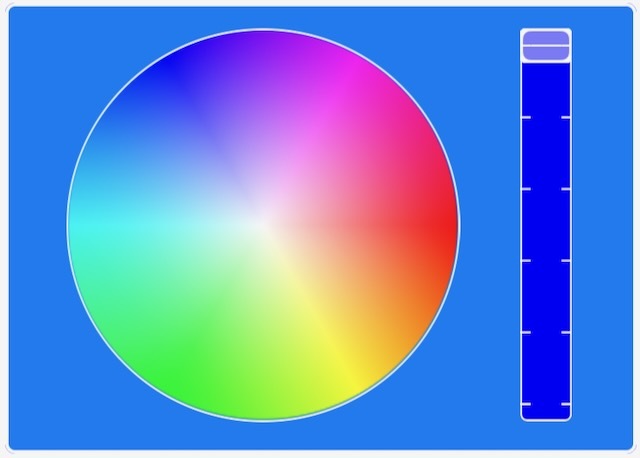
The user picks a colour, sent as #RRGGBB.
color_valuesets it, as#RRGGBB.send_color_rgb(red, green, blue)sets it from numbers, andcolor_to_rgb("#23A89F")returns(35, 168, 159).
| Parameter | Default | |
|---|---|---|
title |
"A Color Picker" |
|
style |
ColorPickerStyle.WHEEL |
A colour wheel and brightness slider, or SPECTRUM |
send_only_on_release |
True |
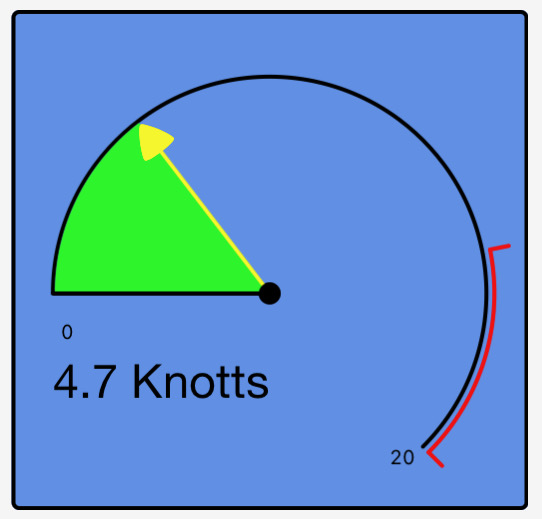
A number on a round dial: set dial_value.
| Parameter | Default | |
|---|---|---|
title |
"A Dial" |
|
dial_min, dial_max |
0.0, 100.0 | The range |
red_value |
75.0 | Where the dial turns red |
dial_fill_color, pointer_color |
Color.RED, Color.BLUE |
|
number_position |
DialNumberPosition.LEFT |
OFF, LEFT, RIGHT or CENTER |
show_min_max |
False | |
style |
DialStyle.PIE |
PIE, PIEINV or BAR |
precision |
Precision.OFF |
|
units |
"" |
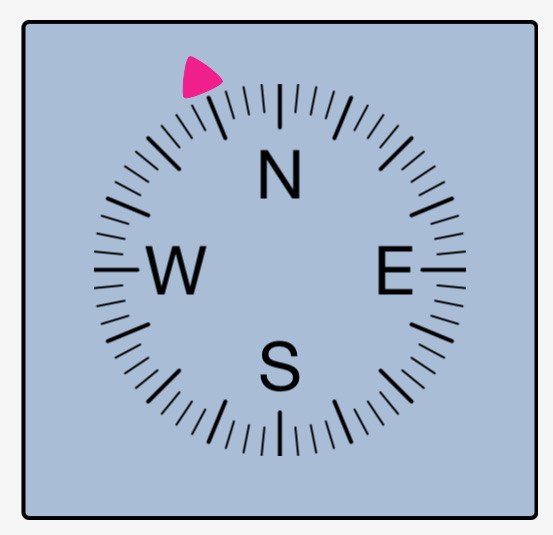
A direction from 0 to 360 degrees: set direction_value, and direction_text for text under it.
| Parameter | Default | |
|---|---|---|
title |
"A Control" |
|
style |
DirectionStyle.DEG |
NSEW, DEG or DEGPS |
pointer_color |
Color.GREEN |
|
units |
"" |
|
precision |
Precision.OFF |
|
calibration_angle |
0 | The calibration angle offset |
Plays or shows what's at a URL: an image, or an audio or video stream. Set url. Its default title is "A Audio visual display".
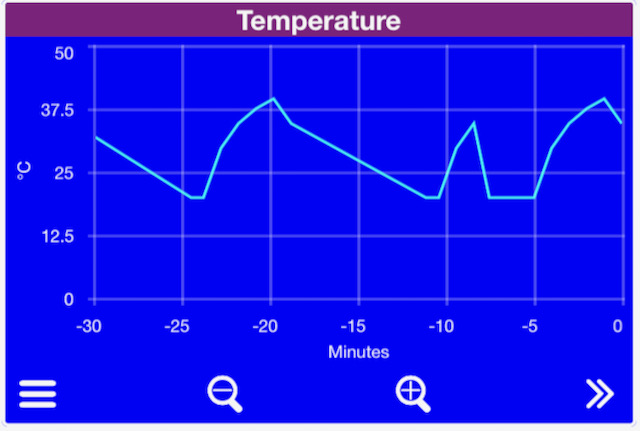
Values over time, in lines the user can pan and zoom. Each line is a TimeGraphLine, added to the graph with an ID:
graph = dashio.TimeGraph("tg1", "Climate", y_axis_label="°C", y_axis_max=40.0, control_position=dashio.ControlPosition(0.0, 0.5, 1.0, 0.4))
graph.add_line("temp", dashio.TimeGraphLine("Temperature", color=dashio.Color.RED))
graph.add_line("both", dashio.TimeGraphLine(["Inside", "Outside"], color=None))
device.add_control(graph)

graph.line_dict["temp"].add_data_point(21.5)
graph.line_dict["both"].add_data_point([21.5, 14.0]) # A line of arraysadd_data_point(value)adds a value, stamped with the current time, and sends it. A value is an int, float, bool or numeric string, or a list for a line of arrays (several values at each time, e.g. a min, mean and max).add_break()adds a gap to the line.- The app asks for the points since the last one it has, so it fills in what it missed. They come from each line's ring buffer, from a DashStore, or from the Dash server with
storage_enable()(storage.md). graph.delete_history(line_id=None)deletes a line's points, or every line's, on the device and the Dash server (storage.md).
| TimeGraphLine parameter | Default | |
|---|---|---|
name |
"" |
A list of names for a line of arrays, e.g. ["Inside", "Outside"] |
line_type |
TimeGraphLineType.LINE |
LINE, BAR or BOOL |
color |
Color.BLACK |
None lets the app choose, e.g. for a line of arrays |
max_data_points |
60 | The size of the line's ring buffer |
break_data |
False | Shows a break where data is missing |
right_axis |
False | Plots against the right axis |
| TimeGraph parameter | Default | |
|---|---|---|
title |
"A TimeGraph" |
|
y_axis_label |
"Y axis" |
|
y_axis_min, y_axis_max |
0.0, 1000.0 | |
y_axis_num_bars |
5 | Grid lines |
y_axis_label_rt, y_axis_min_rt, y_axis_max_rt |
"", 0.0, 1000.0 |
The right axis |
A list of events, each with a time, a colour and lines of text. The newest is shown on the control, and the user taps it for the list.
log = dashio.EventLog("log1", "Events", control_position=dashio.ControlPosition(0.0, 0.0, 1.0, 0.2))
device.add_control(log)

log.add_event_data(dashio.EventData("Pump started\nTank at 40%", dashio.Color.GREEN))
EventData(lines, color=Color.WHITE): up to 25 lines of text, separated by\n, stamped with the current time.add_event_data(event)adds it to the log and sends it.send_event(event)sends it without adding it, andsend_latest_data()sends the newest again.- The app asks for the events since the last one it has. They come from the log's ring buffer (
max_log_entries, default 100), from a DashStore, or from the Dash server withstorage_enable(). delete_history()deletes the entries on the device and the Dash server (storage.md).- Several devices can show events in one EventLog.
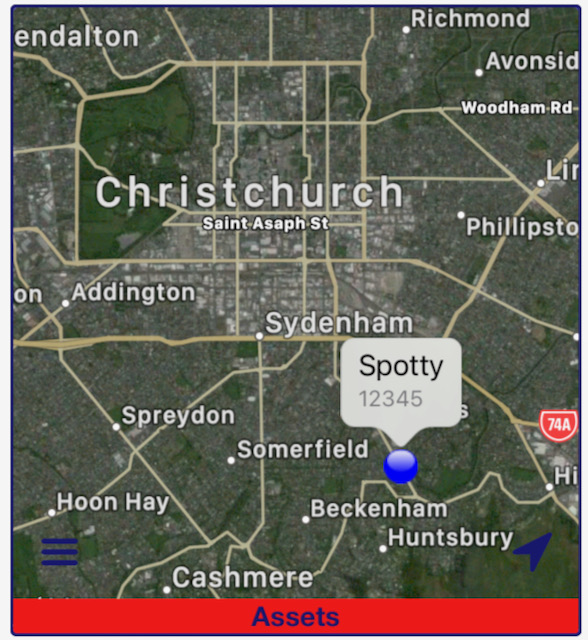
Locations on a map, in tracks. Each track has an ID, a name and a colour. A track is made the first time a location is added to it, or added with add_track() to give it a name and colour:
fleet = dashio.Map("map1", "Fleet", control_position=dashio.ControlPosition(0.0, 0.0, 1.0, 0.5))
device.add_control(fleet)
fleet.add_track(dashio.MapTrack("trip", "Today's trip", dashio.Color.BLUE))
fleet.add_track(dashio.MapTrack("pos", "Truck 1", dashio.Color.RED, replace=True))

fleet.add_location_to_track(dashio.MapLocation("-43.580024", "172.652574", altitude="184.2"), "trip")
fleet.add_location_to_track(dashio.MapLocation("-43.580024", "172.652574"), "pos")
MapLocation(latitude, longitude, average_speed=None, peak_speed=None, course=None, altitude=None, distance=None), stamped with the current time. Give the values as strings.MapTrack(track_id, text="", color=Color.RED, replace=False). Withreplace=Trueit's a "where it is now" marker: the Dash server keeps only its latest location, not a track log.add_location_to_track(location, track_id)adds a location and sends it.send_location(location, track_id="")sends one without adding it.delete_history(track_id=None)deletes a track's locations, or every track's, on the device and the Dash server (storage.md).- Several devices can show tracks on one Map. Its default title is
"A Map".
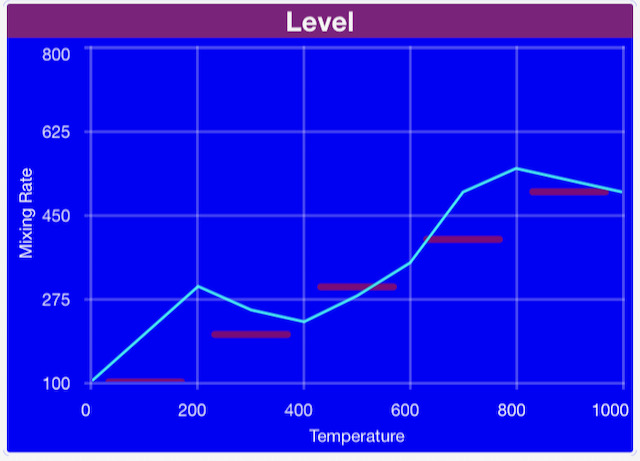
Lines or bars of values, evenly spaced along the X axis. Each line is a ChartLine, added with an ID:
chart = dashio.Chart("chart1", "Spectrum", y_axis_max=100.0, control_position=dashio.ControlPosition(0.0, 0.0, 1.0, 0.4))
line = dashio.ChartLine("Level", dashio.ChartLineType.BAR, color=dashio.Color.BLUE)
chart.add_line("level", line)
device.add_control(chart)

line.data = [12, 40, 87, 55, 23]
chart.send_chart()| ChartLine parameter | Default | |
|---|---|---|
name |
"" |
|
line_type |
ChartLineType.LINE |
LINE, BAR, SEGBAR or PEAKBAR. DELETE removes the line from the chart |
color |
Color.BLACK |
|
right_axis |
False |
| Chart parameter | Default | |
|---|---|---|
title |
"A Chart" |
|
x_axis_label, x_axis_min, x_axis_max |
"", 0.0, 100.0 |
|
x_axis_num_bars |
5 | |
x_axis_labels_style |
ChartXAxisLabelsStyle.ON |
Or BETWEEN |
y_axis_label, y_axis_min, y_axis_max |
"", 0.0, 1000.0 |
|
y_axis_num_bars |
5 | |
y_axis_label_rt, y_axis_min_rt, y_axis_max_rt |
"", 0.0, 1000.0 |
The right axis |
Rows of values, each with a label, and an optional row of headings.
table = dashio.Table("tbl1", "Tanks", columns=3, column_headings=["Tank", "Level", "Temp"], control_position=dashio.ControlPosition(0.0, 0.0, 1.0, 0.3))
device.add_control(table)

table.add_table_row(dashio.TableRow("North", [82, 14.5]))
table.update_table_row(dashio.TableRow("North", [80, 14.6]), 0)
TableRow(label=None, columns=None, units=None): the columns can be text or numbers.add_table_row(row)adds and sends a row.update_table_row(row, row_number)replaces a row, or adds it if there isn't one, and returns its index.clear_row(row_number)andclear_table()clear them.
| Parameter | Default | |
|---|---|---|
title |
"A Table Box" |
|
precision |
Precision.OFF |
|
font_size |
12 | |
label_width_percent |
50 | |
columns |
2 | Columns, including the label |
column_headings |
None |
alarm = dashio.Alarm("hiTemp")
device.add_control(alarm)
alarm.send("High temperature", "The greenhouse is at 35°C")
send(header, body) sends a notification to the phones registered to your Dash account, through the Dash server, so it needs a DashConnection. Which phones get it, and its sound, are set in the app. An Alarm isn't part of a layout.
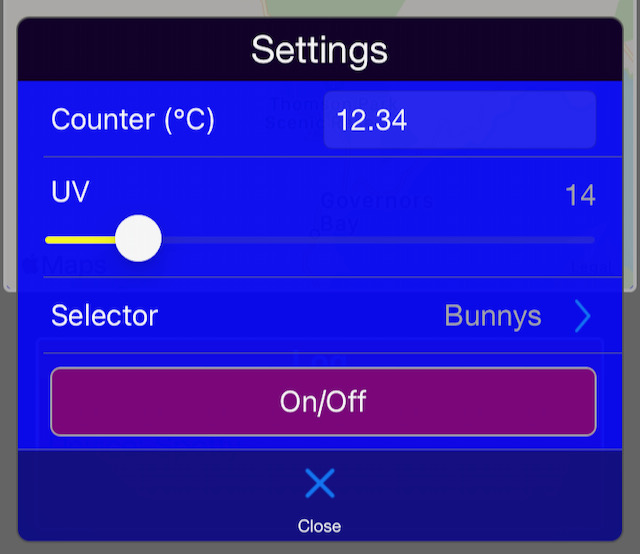
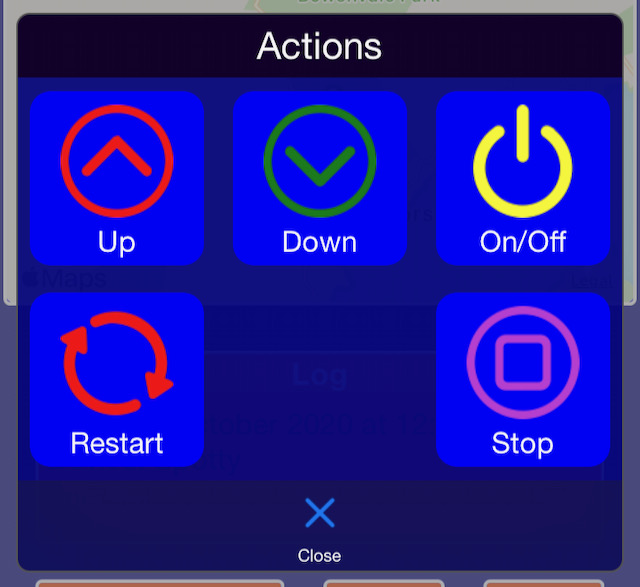
A Menu shows a popup list of TextBoxes, Sliders, Selectors and Buttons, added with add_control(). A ButtonGroup shows a popup grid of Buttons, added with add_button(). The controls in them work as they do anywhere else, and their values are sent when the user opens the Menu or ButtonGroup. A Menu can also go in the app's provisioning menu. See layouts.md.
| Menu parameter | Default | |
|---|---|---|
title |
"A Menu" |
|
text |
"A Menu with Text" |
|
style |
MenuStyle.BASIC |
Or HIGHLIGHT |
icon_name |
Icon.MENU |
| ButtonGroup parameter | Default | |
|---|---|---|
title |
"A Button Group" |
|
text |
"A Button group with Text" |
|
style |
ButtonGroupStyle.BASIC |
Or HIGHLIGHT |
icon |
Icon.MENU |
|
grid_view |
True | False shows a list |
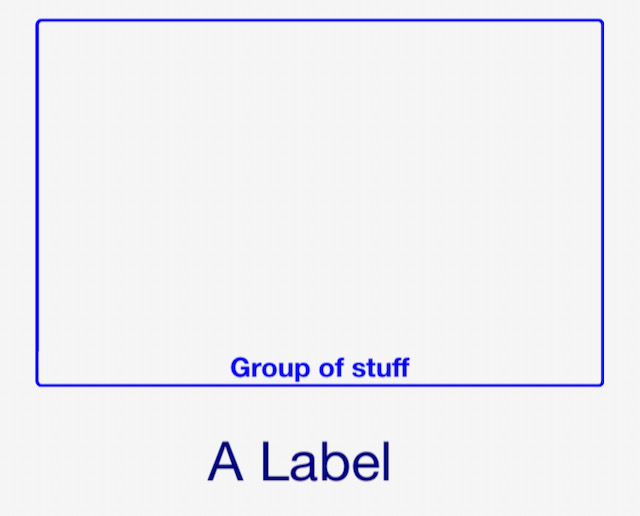
A Label gives a layout structure: a heading, a box or a fill. Its parameters are title (default "A label"), color (Color.WHITE) and style (LabelStyle.BASIC, GROUP, BORDER or FILL).
A DeviceView is a screen of controls in the app. Add controls to it with add_control(), and add it to the device. Its settings are the defaults for the controls on it:
| Parameter | Default | |
|---|---|---|
title |
"A DeviceView" |
|
style |
DeviceViewStyle.BASIC |
Or BORDERS |
icon |
Icon.SQUARE |
|
color |
Color.BLACK |
|
share_column |
True | Another DeviceView can share the column, if there's room |
num_columns |
1 | How many columns wide it is, 1 to 3 |
control_title_box_color, control_title_box_transparency |
Color.BLACK, 0 |
|
control_color, control_border_color |
Color.WHITE_SMOKE |
|
control_background_color, control_background_transparency |
Color.BLACK, 0 |
|
control_title_font_size, control_max_font_size |
16, 20 | |
num_grid_columns, num_grid_rows |
22, 32 | The grid in the app's layout editor |
user_tappable_color |
"" |
The colour of what the user can tap, e.g. a time graph's buttons or a Menu's icon. Unset, the control colour |
Color names the app's colours, e.g. Color.RED, Color.SEA_GREEN. Settings that take a colour also take a hex string such as "#23A89F". Icon names the app's icons, e.g. Icon.PLAY, Icon.LIGHT_BULB. Their full lists are in dashio/iotcontrol/enums.py.