



An end-to-end analytics pipeline uncovering critical delivery failures across $36.8M in orders
A global e-commerce company is losing customer trust — but nobody knows exactly where, why, or how badly.
Logistics managers had no single view of delivery performance. Orders were being shipped, but:
- Were they arriving on time?
- Were they arriving complete?
- Which regions were failing most?
- Which shipping modes were worth the premium cost?
Without answers, every corrective action was a guess.
A 4-page interactive Power BI dashboard backed by a fully engineered SQL Server data warehouse — giving logistics managers a single source of truth to isolate bottlenecks, quantify failures, and prioritize corrective action in real time.
Raw CSV (180,519 rows, 53 columns)
        ↓
  📊 Excel          Schema audit · null checks · pivot discovery
        ↓
  🐍 Python         KPI flag engineering · EDA · clean data export
        ↓
  🗄️ SQL Server     Star schema · 6 KPI views · SLA breach analysis
        ↓
  📈 Power BI       4-page interactive dashboard with drill-down slicers
| # | Finding | Business Impact |
|---|---|---|
| 🔴 1 | First Class shipping: 100% SLA breach across all 23 regions | Customers pay premium price, receive worst service |
| 🔴 2 | OTD rate: 40.9% vs 85%+ industry benchmark | Less than half of all orders arrive on time |
| 🔴 3 | South of USA: 2nd worst globally at 39.5% OTD | Regional bottleneck confirmed and quantified |
| 🔴 4 | Perfect Order Rate: only 14% | 86% of orders fail on at least one dimension |
| 🔴 5 | OTD flat below 45% across 36 months | Structural failure — not a temporary disruption |
Overall supply chain health at a glance
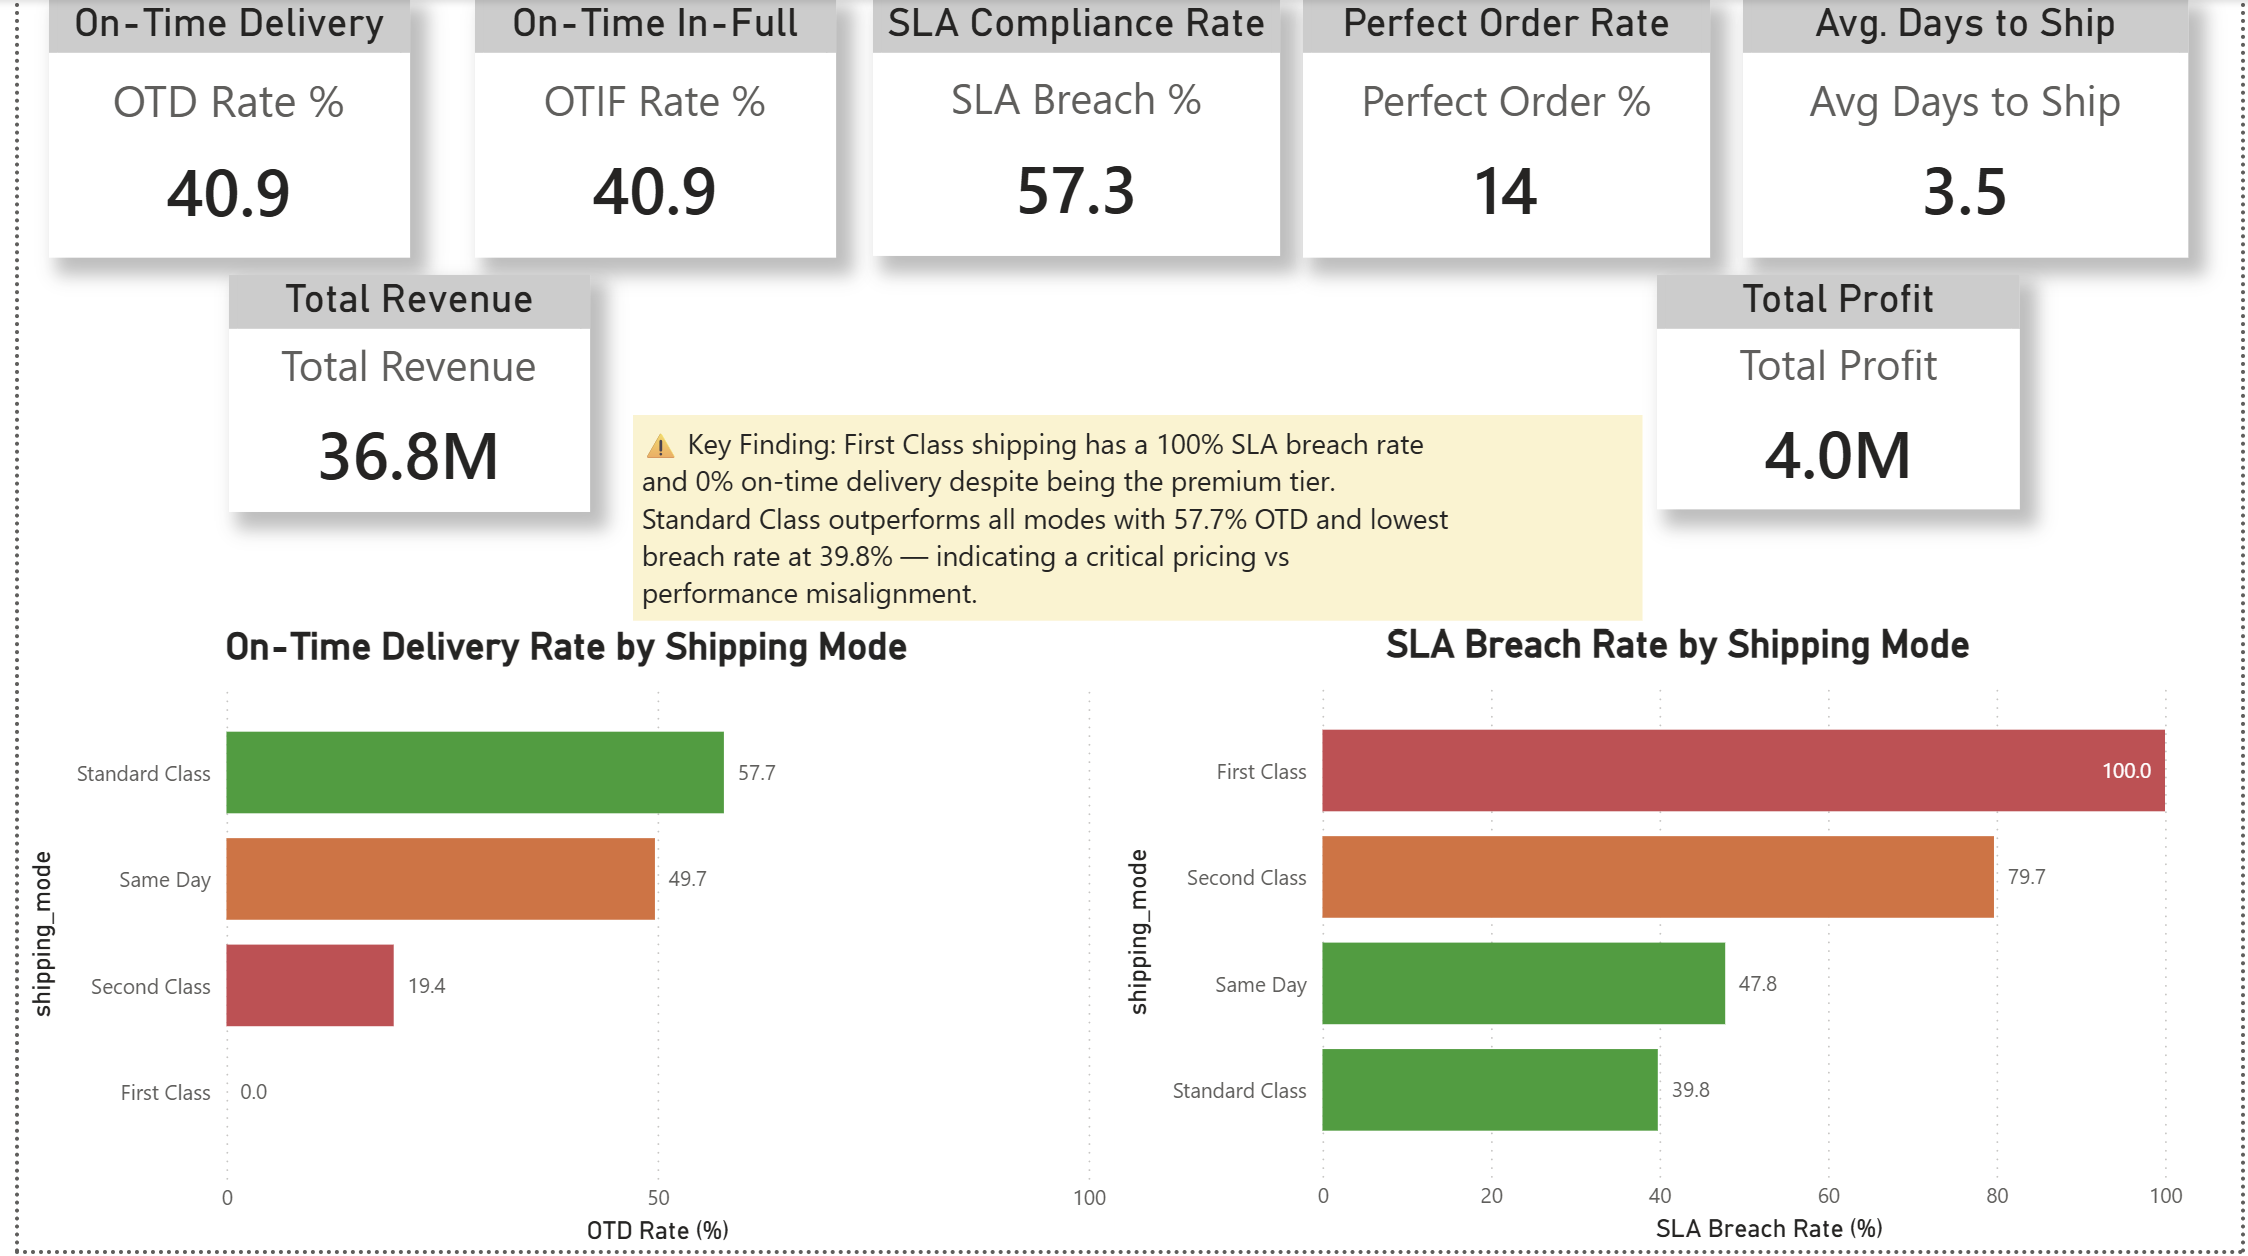
What it shows:
- 7 KPI scorecards: OTD (40.9%), OTIF (40.9%), SLA Breach (57.3%), Perfect Order (14%), Revenue ($36.8M), Profit ($4.0M), Avg Days to Ship (3.5)
- Side-by-side color-coded bar charts: OTD Rate vs SLA Breach Rate by shipping mode
- Key finding callout: First Class = 0% OTD, 100% SLA breach
Which regions are failing — and by exactly how much?
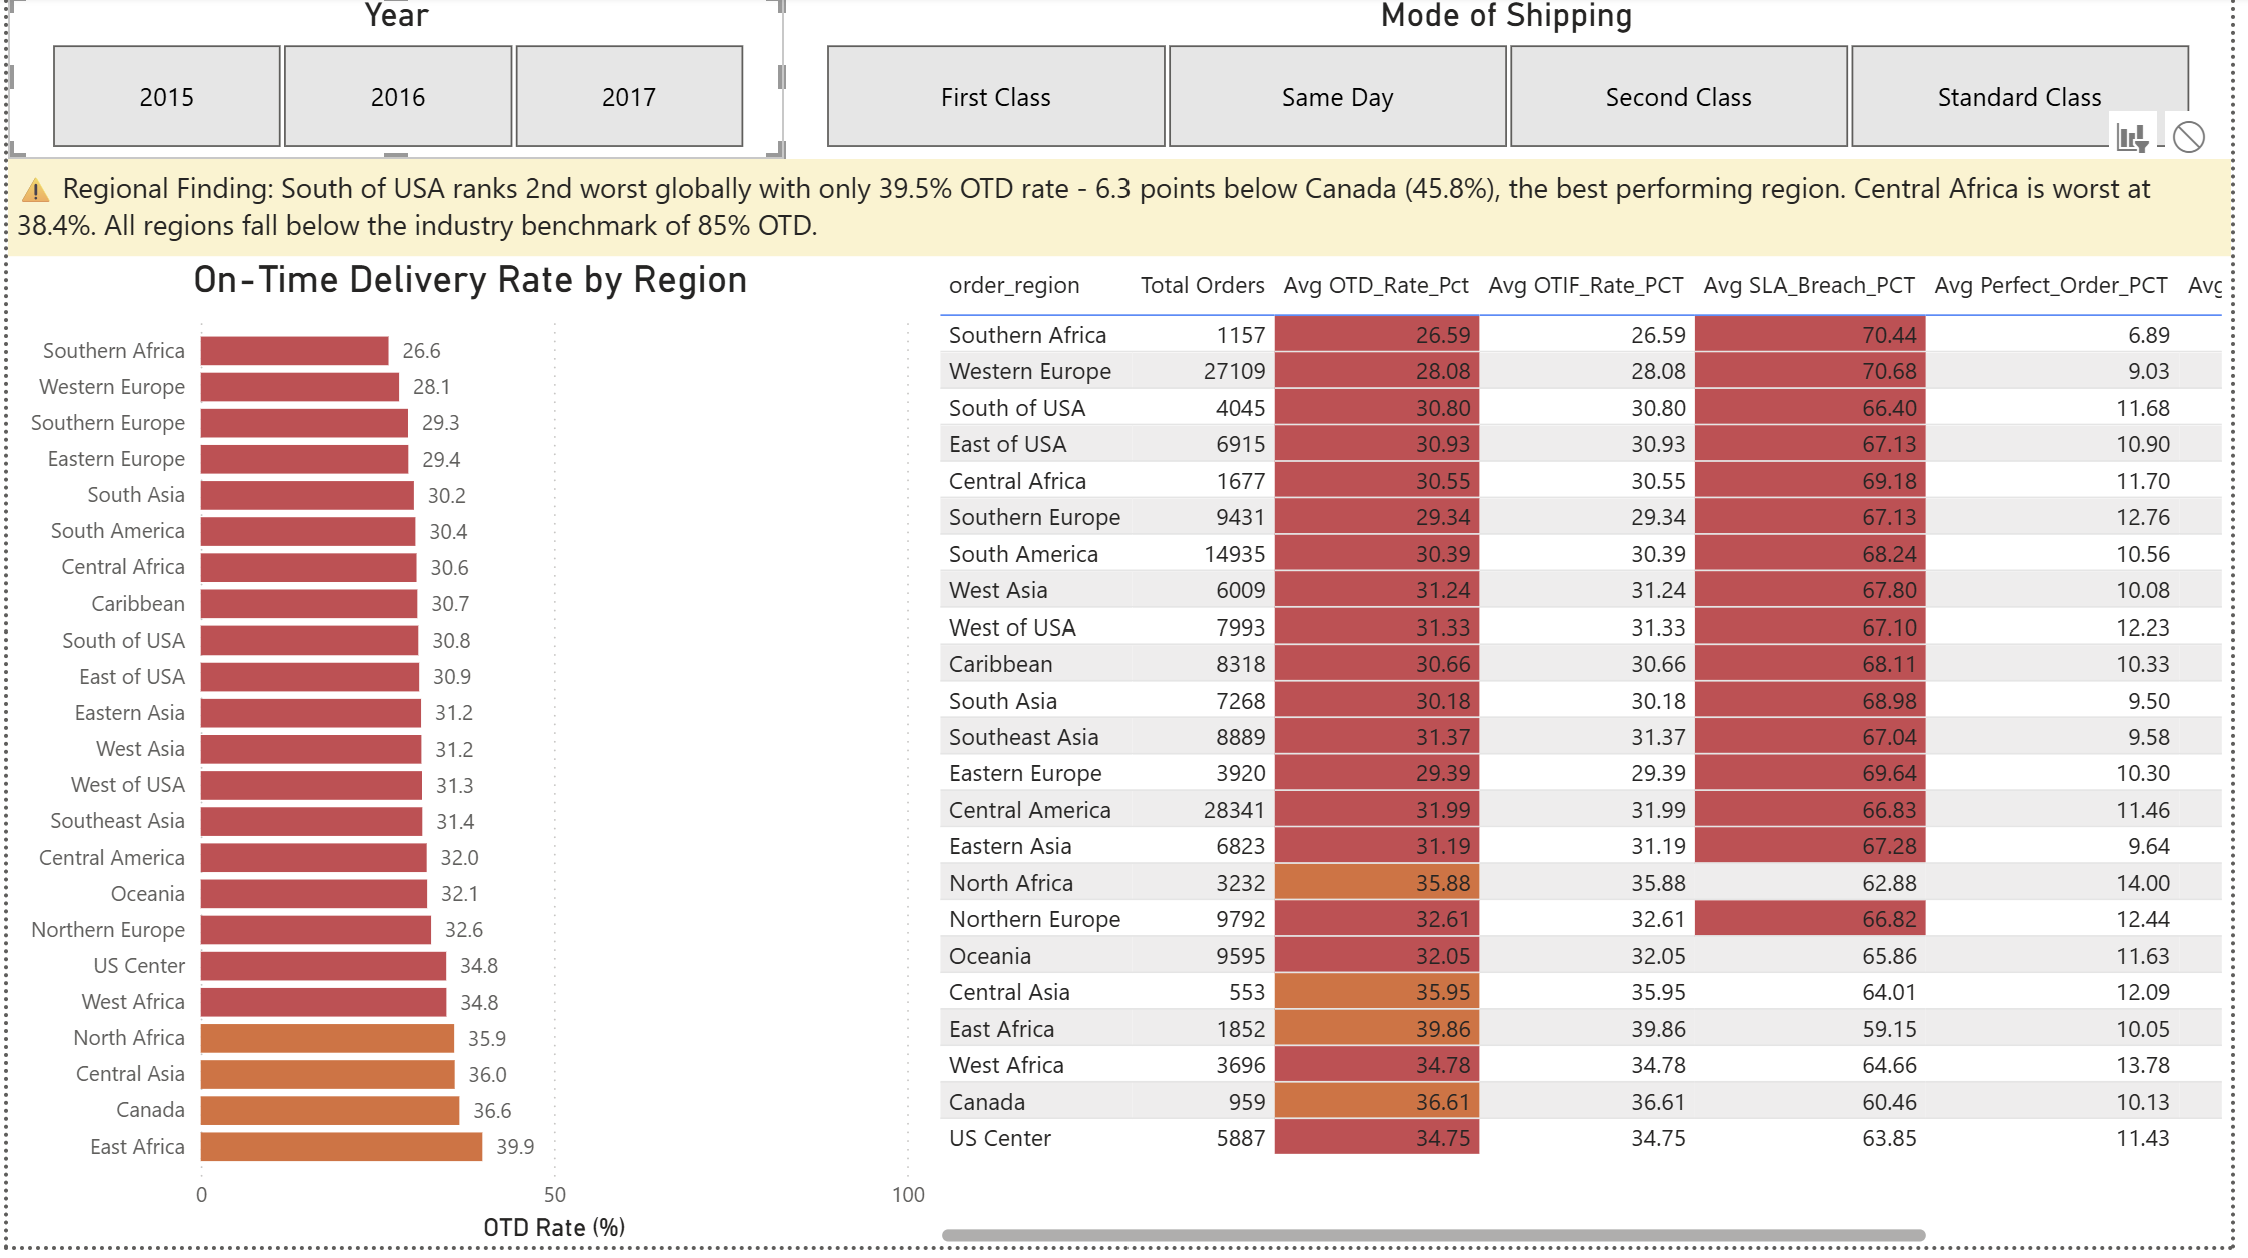
What it shows:
- All 23 global regions ranked worst → best by OTD rate
- Interactive slicers: filter by Year (2015/2016/2017) and Shipping Mode
- Color-coded KPI table with 6 metrics per region
- South of USA (39.5%) and Central Africa (38.4%) flagged as critical
Which region + shipping mode combination is most broken?
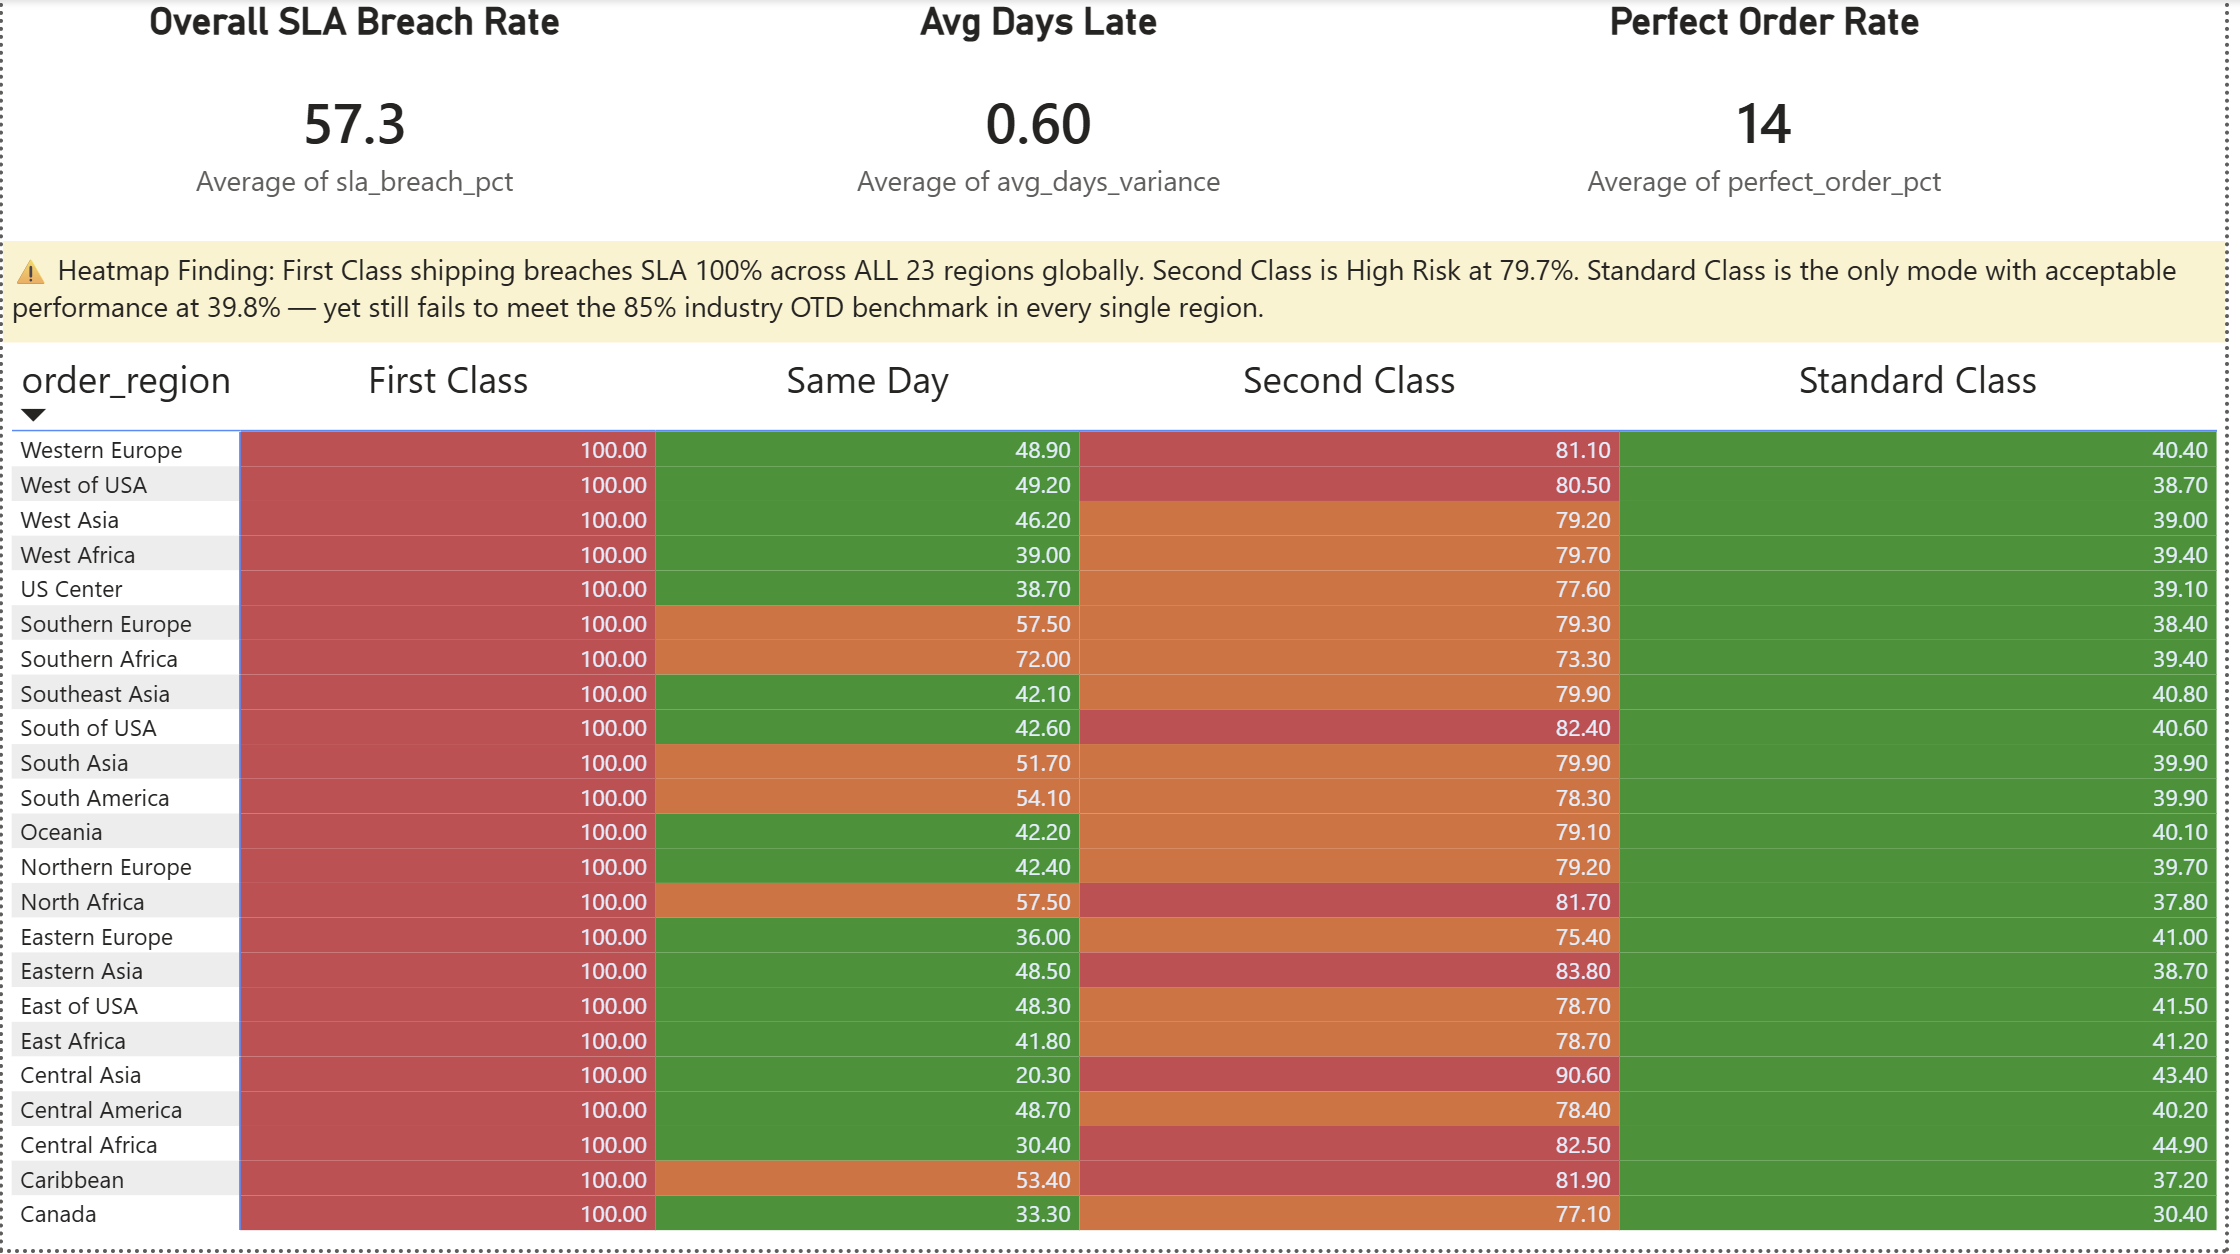
What it shows:
- 23 × 4 interactive matrix (Regions × Shipping Modes)
- 🔴 Red = Critical (≥80% breach) | 🟠 Orange = High Risk | 🟢 Green = Acceptable
- Entire First Class column is Critical (100%) across all 23 regions
- Standard Class is the only mode with acceptable performance globally
Has performance improved over 3 years?
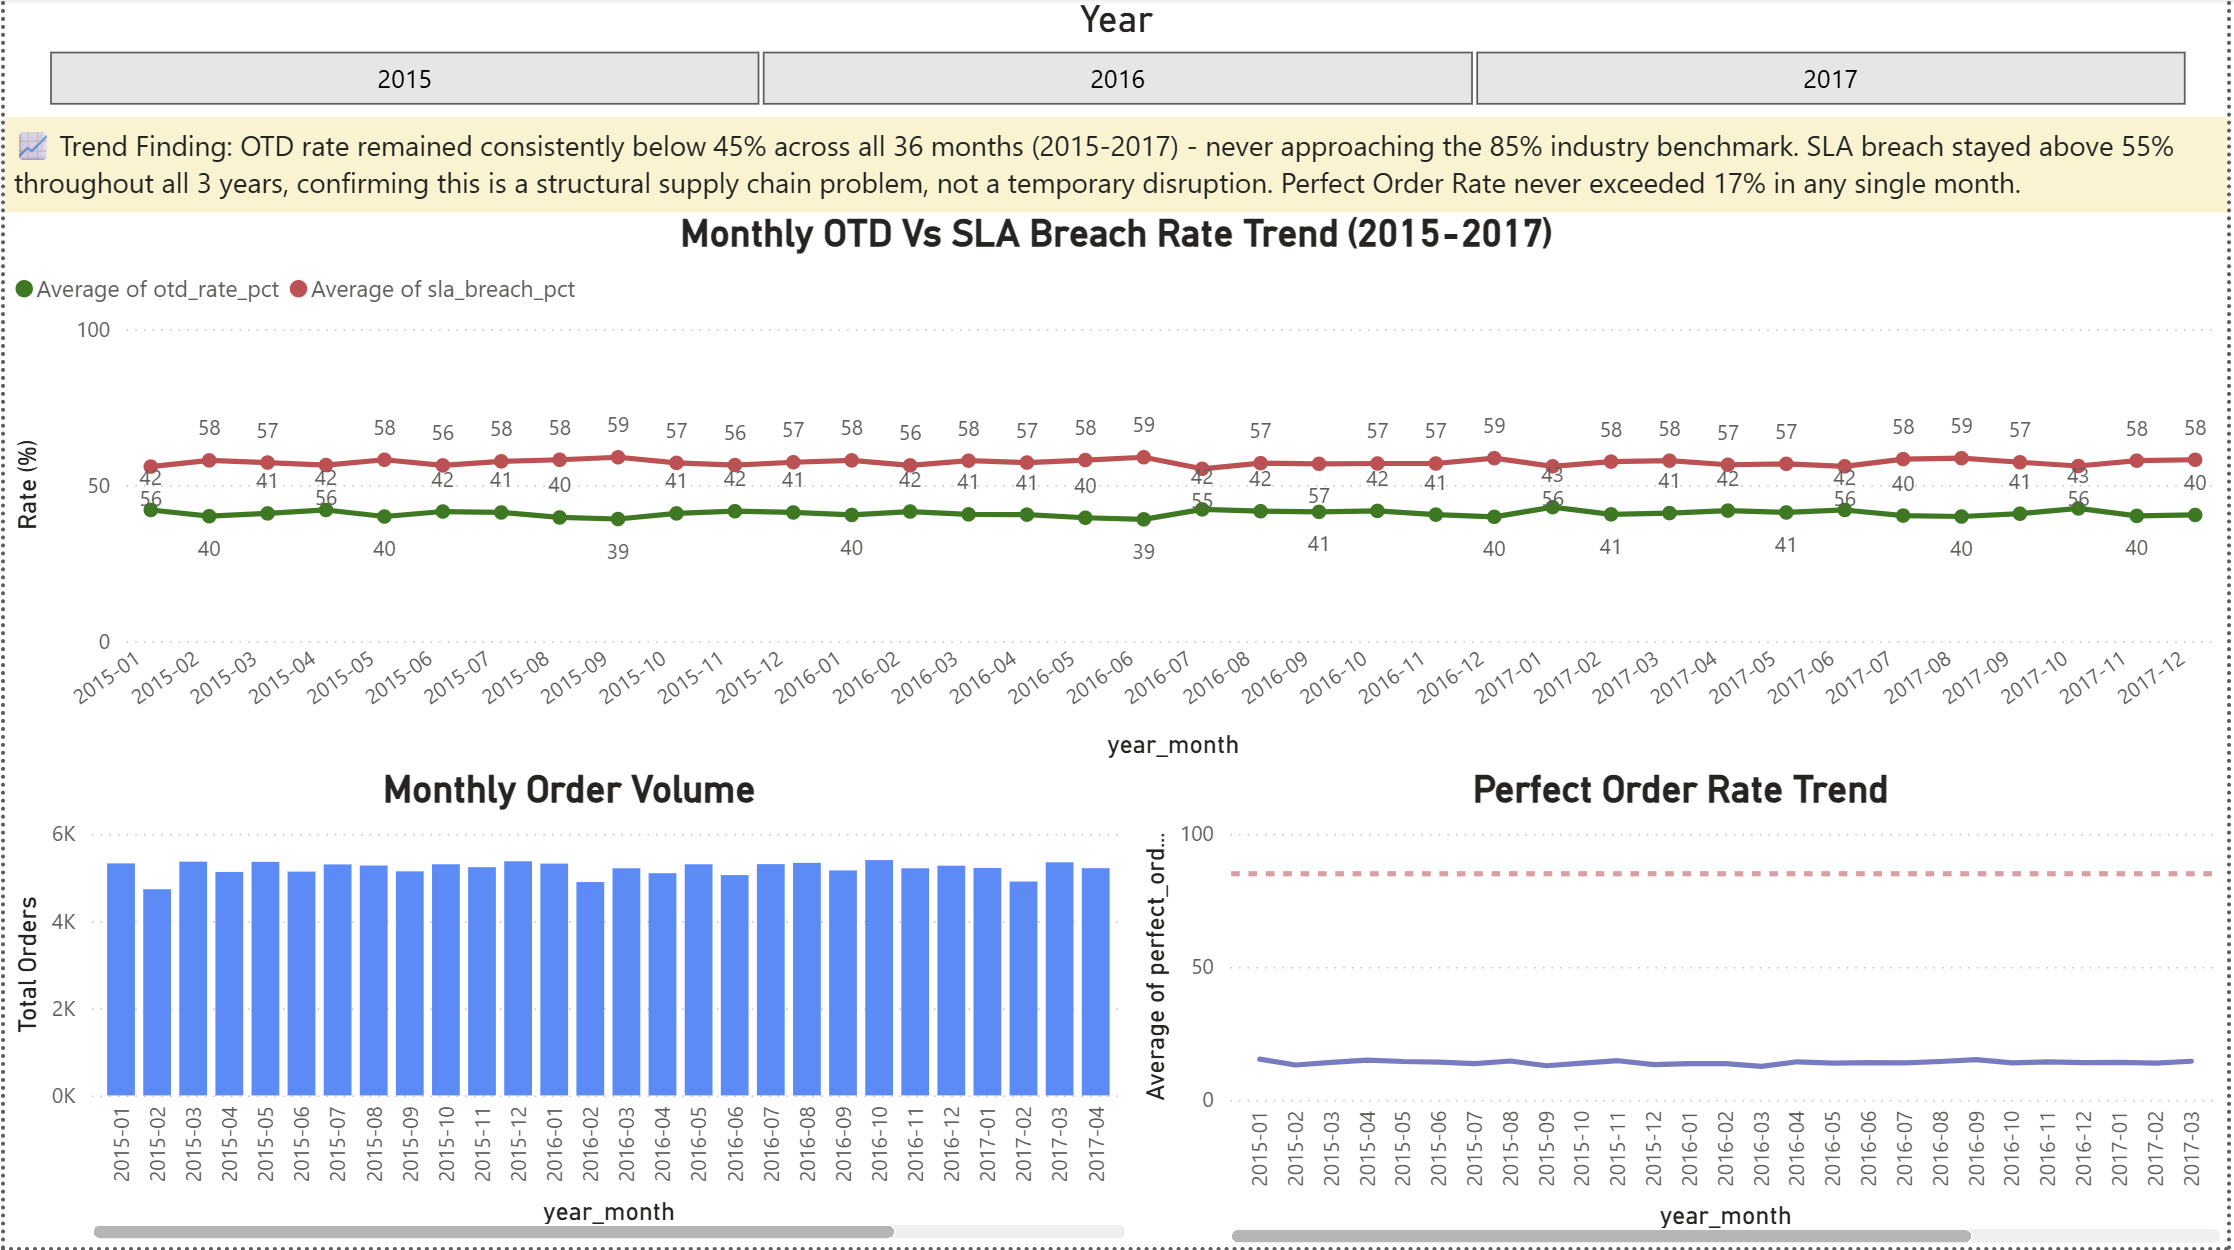
What it shows:
- 36-month OTD vs SLA Breach trend lines (2015–2017)
- Monthly order volume (consistent ~5,000 orders/month)
- Perfect Order Rate vs 85% industry benchmark line
- Verdict: Zero improvement — flat lines confirm a structural problem
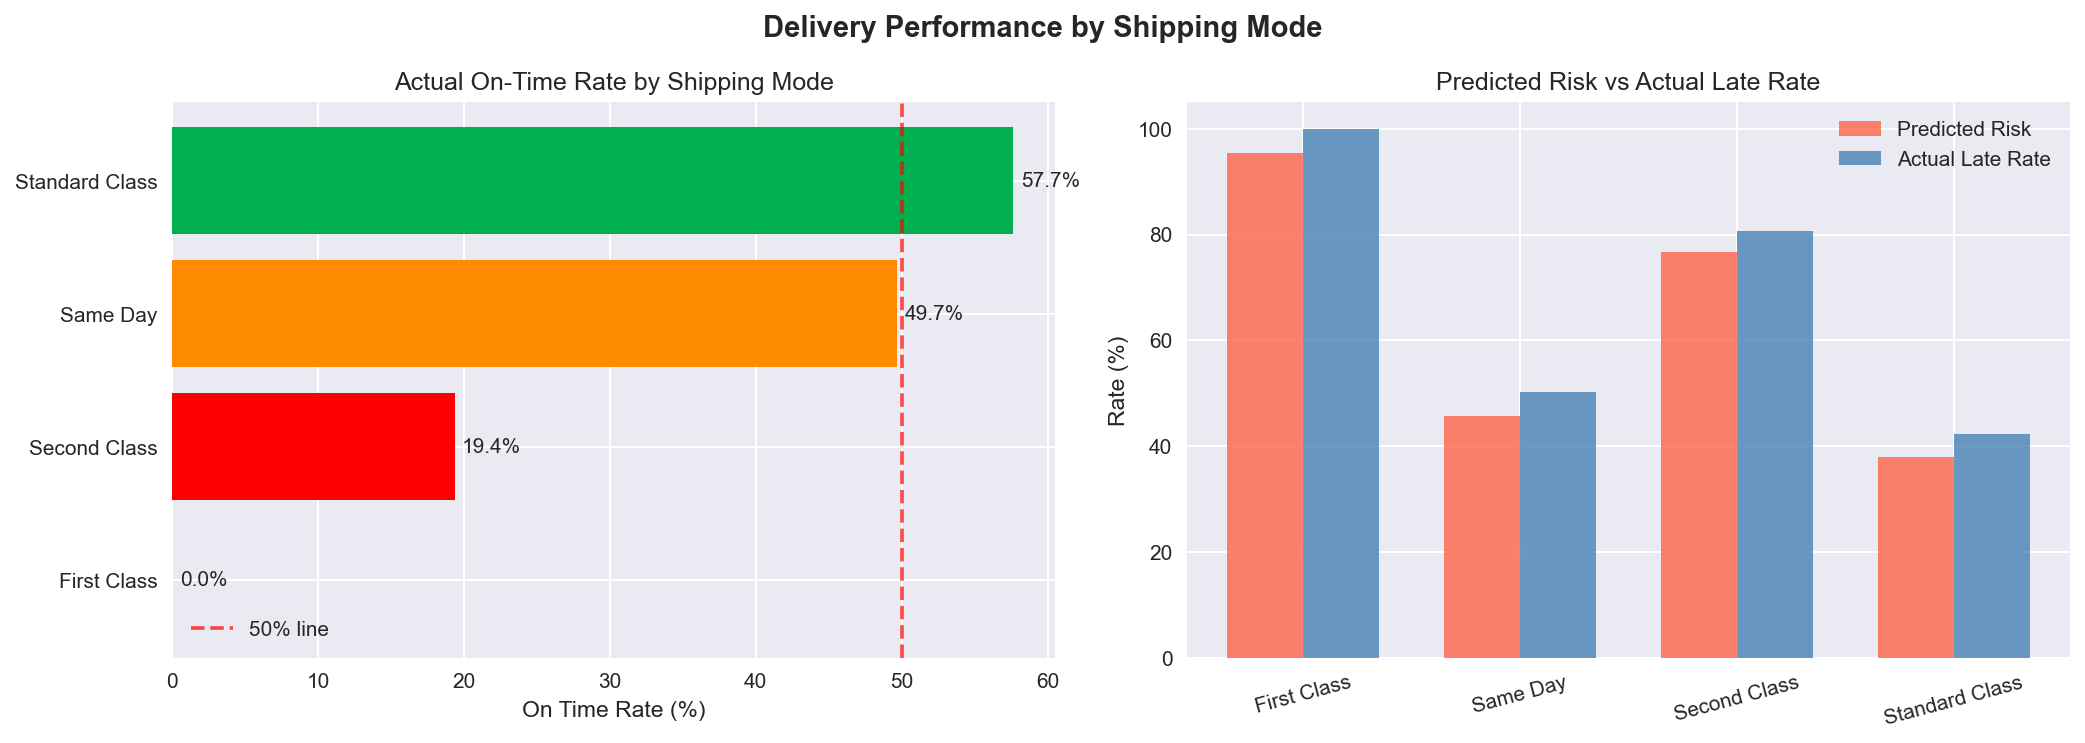
Predicted risk score vs actual late delivery rate — First Class predicted risky AND actually worst performer
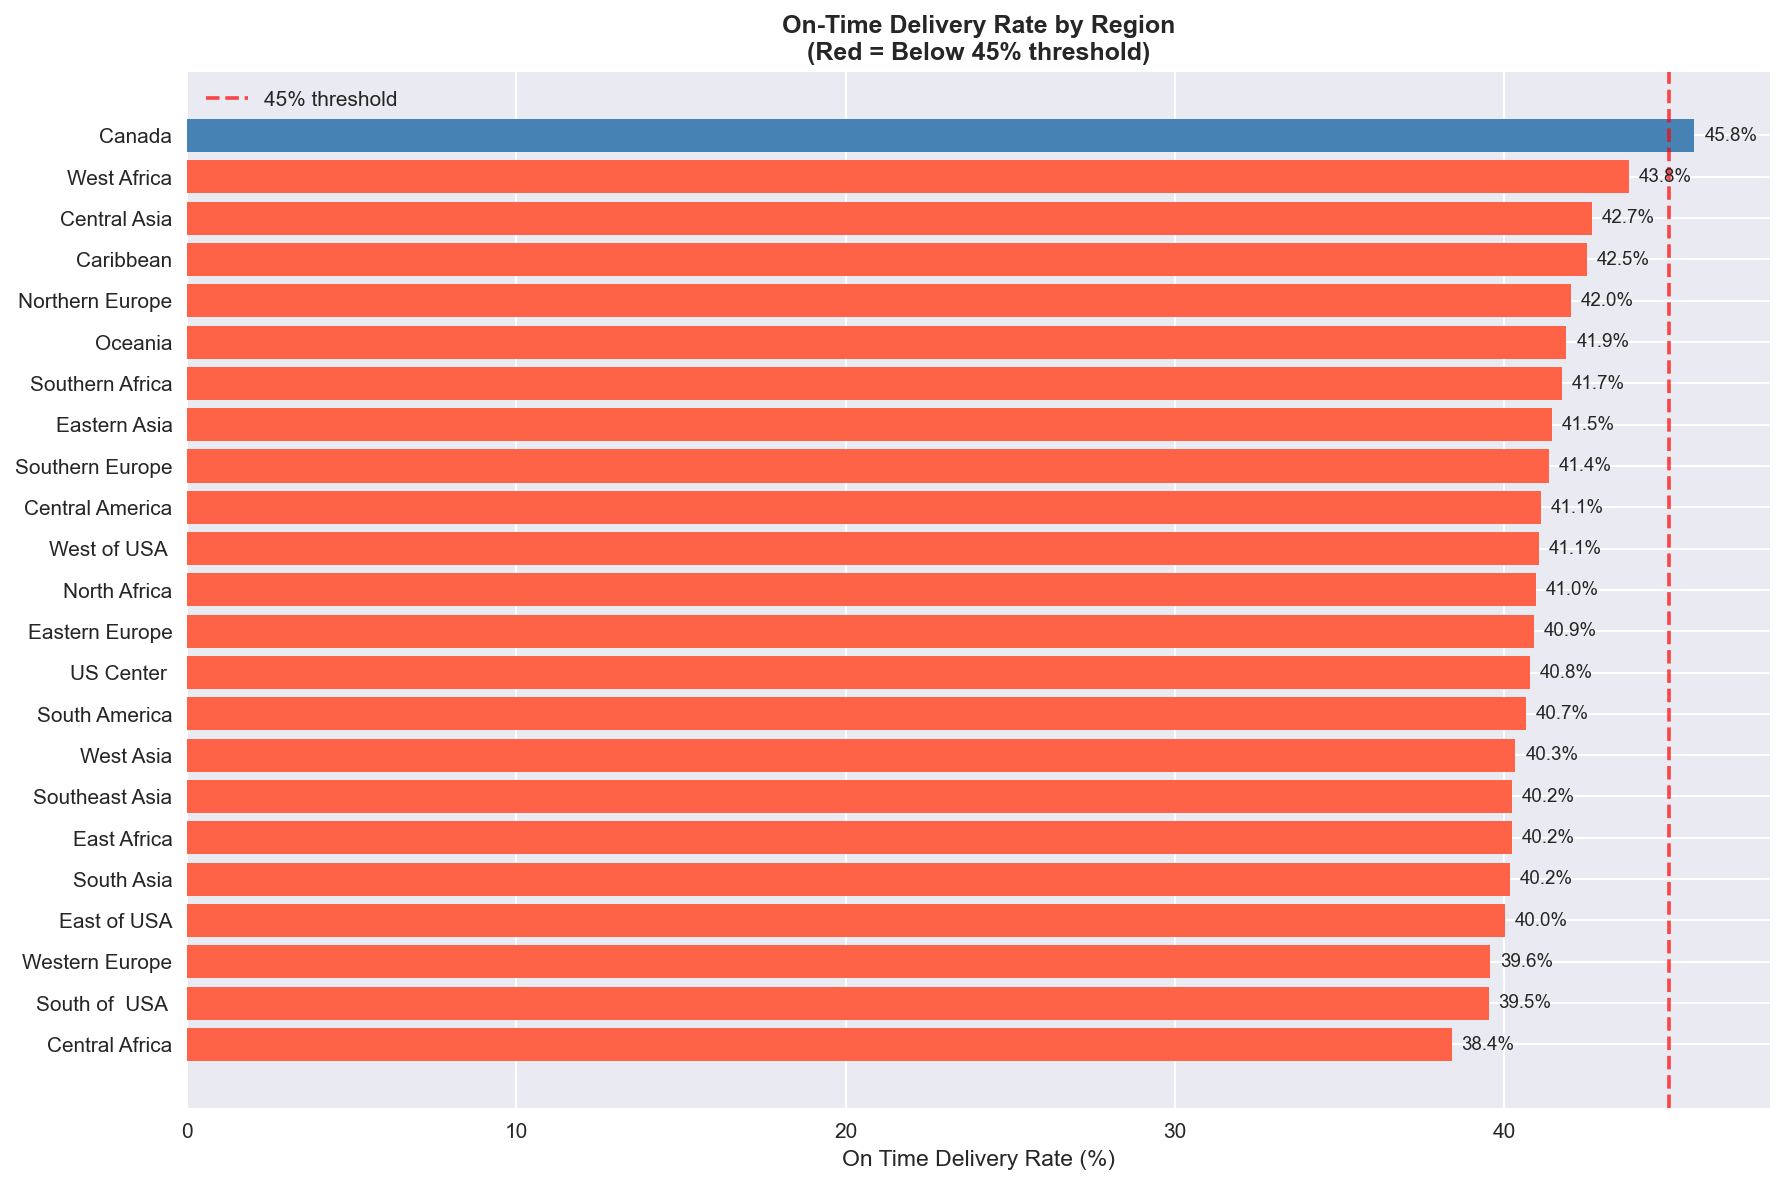
All 23 regions clustered between 38–46% OTD — no region close to the 85% benchmark
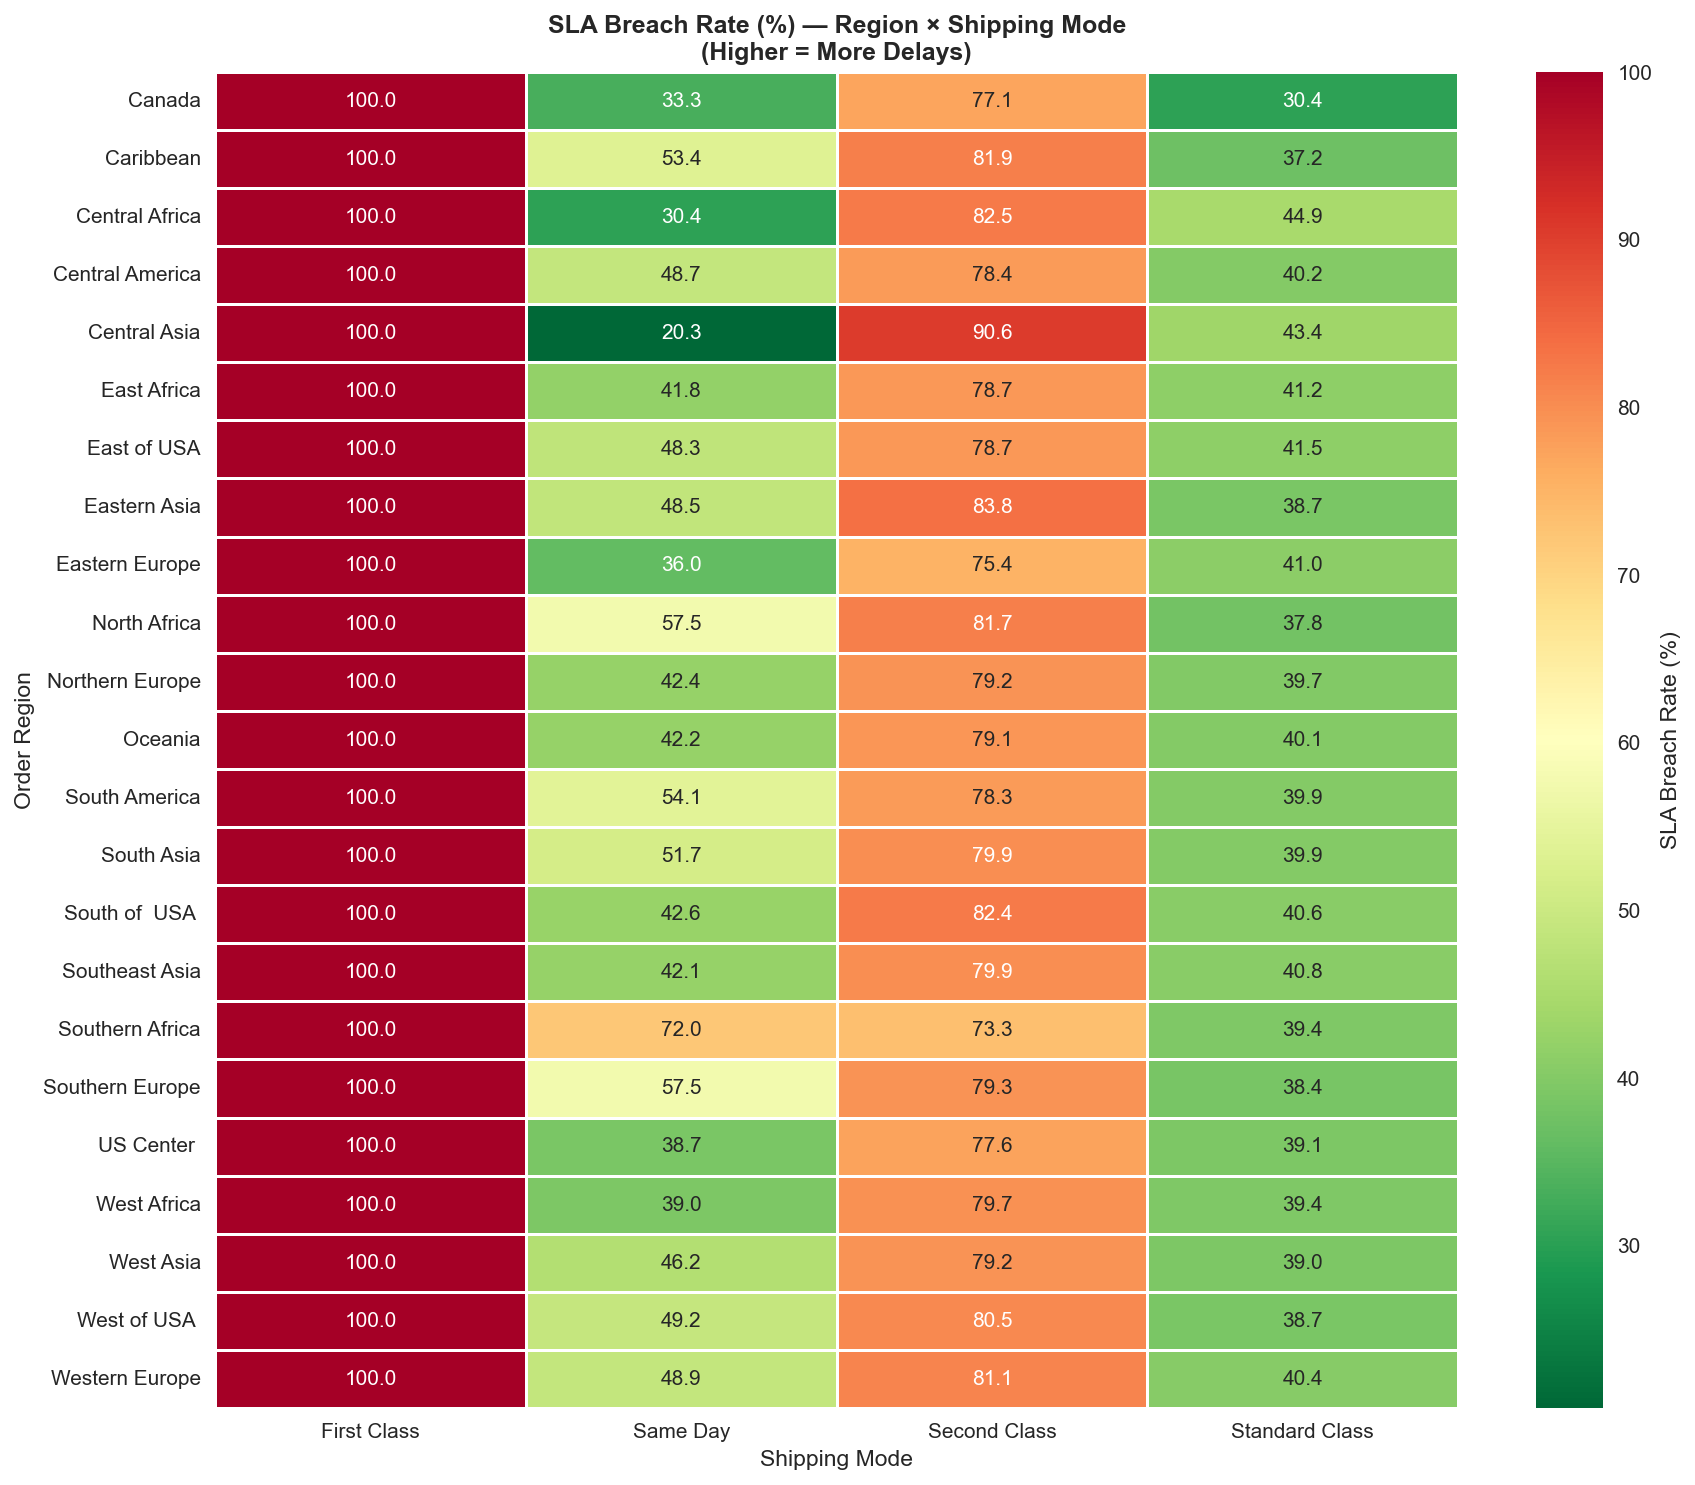
Cross-analysis that first surfaced the hidden delay story — engineered in Python before SQL
                      DIM_Date
                         │
DIM_Customer ──── FACT_Orders (180,519 rows) ──── DIM_Shipping
                         │
               DIM_Region   DIM_Product
                         │
                    DIM_Geography
# Binary flags engineered as new columns
is_on_time       = delivery_status in ['Advance shipping', 'Shipping on time']
is_complete      = order_status == 'COMPLETE'
is_sla_breach    = days_shipping_real > days_shipping_scheduled
is_otif          = is_on_time AND is_qty_fulfilled
is_perfect_order = is_on_time AND is_complete AND NOT is_sla_breach
days_variance = days_shipping_real - days_shipping_scheduledVW_KPI_Summary -- Overall KPI scorecards (1 row)
VW_KPI_By_ShippingMode -- Performance by shipping mode (4 rows)
VW_KPI_By_Region -- Regional breakdown with slicers (276 rows)
VW_SLA_Heatmap -- 23×4 region × mode matrix (92 rows)
VW_Monthly_Trend -- 36-month time series (36 rows)
VW_KPI_By_Category -- Product category performance (51 rows)| KPI | Definition | Our Result | Industry Benchmark |
|---|---|---|---|
| OTD | % orders delivered on time | 🔴 40.9% | 85%+ |
| OTIF | % on time AND complete quantity | 🔴 40.9% | 90%+ |
| SLA Breach | % shipments exceeding promised days | 🔴 57.3% | <15% |
| Perfect Order | On-time + complete + undamaged + accurate | 🔴 14.0% | 80%+ |
| Fill Rate | % of order quantity fulfilled immediately | 🟢 100% | 95%+ |
| Avg Days to Ship | Average actual shipping days | 🟠 3.5 days | 2-3 days |
| Days Variance | Actual minus promised shipping days | 🔴 +0.6 days | ≤0 |
1. Investigate First Class SLA commitments 100% breach rate across all 23 regions suggests promised delivery windows are unachievable. Renegotiate carrier SLAs or adjust customer-facing delivery promises immediately.
2. Priority intervention: South of USA & Central Africa Both regions sit below 40% OTD. Route optimization or regional carrier substitution in these two regions alone would impact 5,722 orders annually.
3. Scale Standard Class learnings across all modes Standard Class is best performer (57.7% OTD, 39.8% breach) at the lowest cost. Understanding what makes it relatively reliable could unlock cross-mode improvements.
4. Structural fix required — not incremental tweaks 36 months of flat OTD confirms tactical fixes are not working. A structural review of warehouse dispatch workflows, carrier contracts, and demand forecasting is needed.
supply-chain-logistics-dashboard/
│
├── 📁 Excel/
│   └── Working_Data.csv
│
├── 📁 Python/
│   ├── Supply chain - Data Cleaning and EDA.ipynb
│   ├── plot1_delay_by_shipmode.png
│   ├── plot2_delay_by_region.png
│   └── plot3_sla_heatmap.png
│
├── 📁 SQL/
│   ├── 01_create_database.sql
│   ├── 02_staging_table.sql
│   ├── 03_bulk_insert.sql
│   ├── 04_dimension_tables.sql
│   ├── 05_fact_table.sql
│   ├── 06_rebuild_dim_region.sql
│   ├── 07_validation.sql
│   ├── 08_kpi_views.sql
│   └── 09_view_verification.sql
│
├── 📁 Power BI file/
│   └── Supply_chain_Dashboard.pbix
│
├── 📁 Screenshots/
│   ├── page1_executive_summary.png
│   ├── page2_regional_analysis.png
│   ├── page3_sla_heatmap.png
│   └── page4_trend_analysis.png
│
└── README.md
| Tool | Purpose |
|---|---|
| Microsoft Excel | Data audit, null checks, pivot validation |
| Python 3.12 + pandas, seaborn, matplotlib | Cleaning, KPI engineering, EDA |
| SQL Server Express + T-SQL | Star schema, dimensional modeling, KPI views |
| SSMS 22 | Query development, schema management |
| Power BI Desktop + DAX | 4-page interactive dashboard |
Prerequisites: SQL Server Express · Python 3.8+ · Power BI Desktop · DataCo Dataset from Kaggle
# 1. Run SQL scripts in order (01 → 09) in SSMS

# 2. Run Python notebook
jupyter notebook "Python/Supply chain - Data Cleaning and EDA.ipynb"

# 3. Open Power BI file and update SQL Server connection
#    Server: YOUR_SERVER\SQLEXPRESS  |  Database: SupplyChainDB
End-to-end analytics pipeline · Real-world dataset
⭐ Star this repo if you found it useful