

🇬🇧 English | 🇫🇷 Français | 🇩🇪 Deutsch | 🇪🇸 Español | 🇮🇹 Italiano | 🇳🇱 Nederlands
Last updated: 2026-10-06 03:31:02 UTC



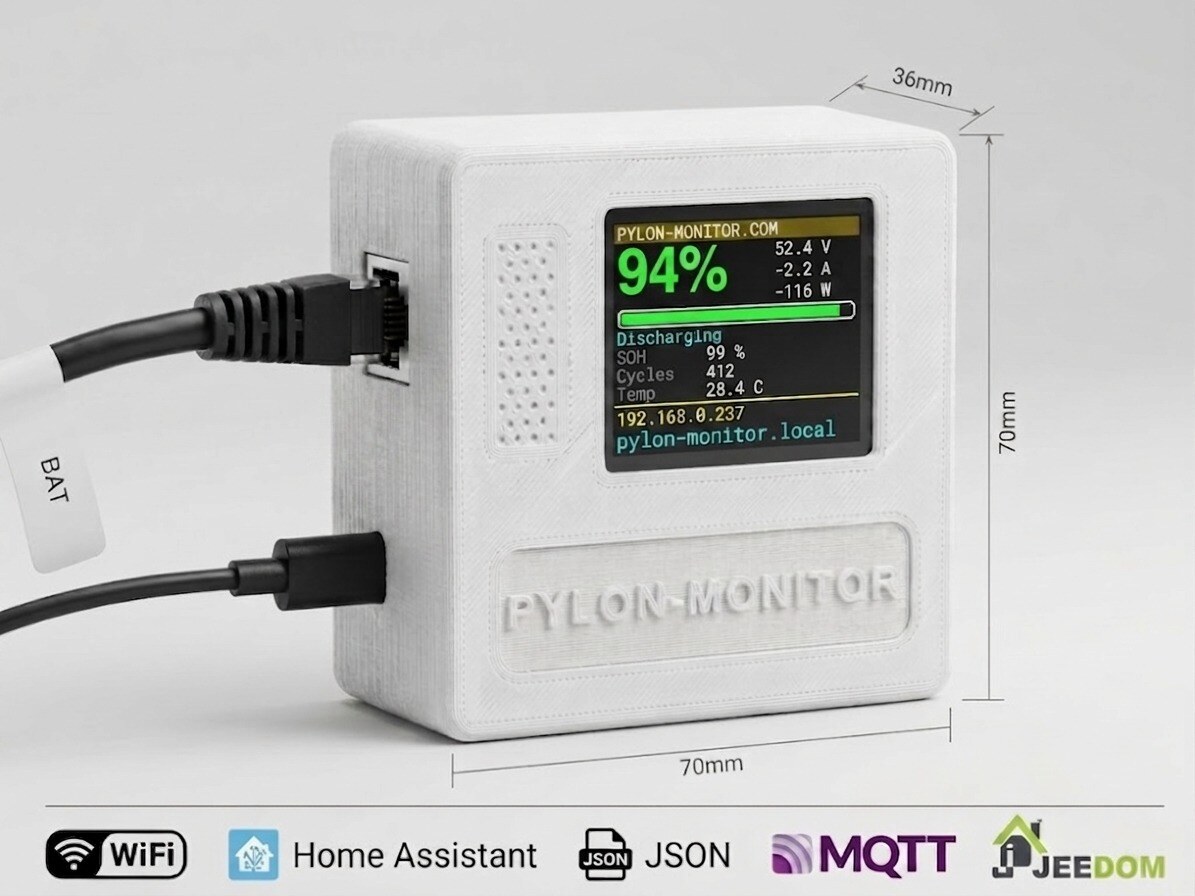
Pylon-Monitor is a small, standalone Pylontech battery monitor: a plug-and-play WiFi device that reads the Console (RS-232) port of Pylontech lithium storage batteries and turns every value — State of Charge, State of Health, voltage, current, power, per-cell voltages, temperatures and alarms — into a clean JSON REST API, a live web dashboard, and a built-in TFT display. It is the fastest way to do Pylontech monitoring, Pylontech diagnostics, and remote / wireless Pylontech battery monitoring — with native Home Assistant, MQTT, Jeedom, Node-RED, Domoticz and openHAB integration, set up in under 2 minutes.
This repository is the public documentation, integration reference and community resource hub for the Pylon-Monitor hardware device. It is not the device firmware or hardware design — see What this repository is (and isn't) below.
- What is Pylon-Monitor?
- Why Pylon-Monitor — Pylontech Monitoring made simple
- Key features
- Models & hardware generations
- Compatible Pylontech batteries
- Under the hood — built for real Pylontech firmware variance
- Quick start — plug & play in under 2 minutes
- JSON REST API — recover your Pylontech battery data
- Home Assistant integration (MQTT auto-discovery & REST)
- Jeedom integration
- Node-RED integration
- Domoticz, openHAB & any HTTP/JSON platform
- Privacy & security — local by default, cloud optional
- Firmware updates
- Frequently asked questions
- What this repository is (and isn't)
- Available languages
- Official links
- License
Pylon-Monitor is a dedicated Pylontech battery monitoring and diagnostics tool — not a generic IoT gadget, not a battery management system, and not affiliated with or endorsed by Pylontech. It connects to the low-voltage Console (RS-232) port of a Pylontech battery, reads the battery's own internal telemetry in real time, and exposes it three ways at once:
- A JSON REST API (
GET /api.json) — one HTTP call, the entire battery state, ready for any script, dashboard or home-automation platform. - A live web dashboard, reachable from any browser on the local network — no app to install.
- A built-in 1.8" TFT display on the device itself, for an at-a-glance reading without even opening a laptop. (not on the Lite, which has no screen)
If you searched for Pylontech monitor, Pylontech monitoring, Pylontech diagnostics, how to monitor Pylontech batteries remotely, Pylontech Home Assistant, Pylontech MQTT, Pylontech Jeedom, read Pylontech battery data, Pylontech SOC SOH monitoring, or wireless / remote Pylontech battery monitoring, this is exactly what Pylon-Monitor does.
Most ways of reading a Pylontech battery's internal state require a laptop plugged into the Console port and vendor software (PYLON Console / BatteryView) running interactively, every single time you want a number. Pylon-Monitor turns that into a permanent, remote, wireless service:
- Plug & play in under 2 minutes. Connect the Console port cable, power the device, join its WiFi setup portal (
PylonMonitor-Setup), pick your home WiFi network. Done. No app, no account, no command line, no soldering. - Always-on remote Pylontech monitoring. Once configured, the battery's SOC, SOH, voltage, current, power, temperature and alarm state are available from anywhere on your local network (or remotely, through your own VPN / reverse proxy — the device itself has no cloud dependency, see Privacy & security).
- Built for integration, not just for looking at a screen. The JSON API and native Home Assistant / MQTT support mean the data flows straight into your existing home-automation, energy-monitoring or logging stack — Home Assistant, Jeedom, Node-RED, Domoticz, openHAB, Grafana, a cron job, a shell script, anything that can do an HTTP GET.
- Up to 16 batteries, mixed models handled correctly. Chained Pylontech systems — up to 16 batteries, e.g. 16× US5000 (≈76.8 kWh) or a mix like US2000 + US3000 + US5000 — are detected and reported individually, with the combined SOC capacity-weighted across models rather than naively averaged, provided the RJ45 cable is plugged into the master unit's Console port. Every cell of all 16 batteries is read and shown; every battery still gets full SOC/voltage/current/power/SOH/cycle readings.
| Feature | Description |
|---|---|
| JSON REST API | GET /api.json returns SOC, SOH, voltage, current, power, state, per-cell voltages, per-battery detail, temperatures, WiFi/MQTT status and more as structured JSON — protected by the device's access key (?key=…), ready for Home Assistant, Node-RED, Jeedom, Domoticz, openHAB or your own scripts. |
| Home Assistant, MQTT auto-discovery | Fill in your MQTT broker's IP and credentials and 10 sensors appear automatically — SOC, SOH, voltage, current, power, battery & MOSFET temperature, cycles, state and cell imbalance — grouped under one device card, plus an online/offline availability signal. Zero YAML. |
| Web dashboard | Live cards refresh every few seconds without reloading the page: Charge (SOC, voltage, current, power, state), Health (SOH, cycles, cell imbalance, charge/discharge counts), Temperatures (base & MOSFET), System (IP, WiFi signal, MQTT status, uptime), Cells & 24h charge history graph. |
| Built-in TFT display, self-healing | A 1.8" IPS screen shows State of Charge in giant digits with voltage/current beside it and SOH/cycles/temperature below — fully customizable, and re-initialised automatically so a power glitch never leaves it stuck. |
| Configurable alarms (push notifications) | Set your own SOC and temperature thresholds, with hysteresis so a single noisy reading doesn't spam you, and get a push notification via Pushover the moment either is crossed. |
| Multi-battery support — up to 16 batteries | Up to 16 batteries chained together — e.g. 16× US5000 (≈76.8 kWh combined) or a mix of models such as US2000 + US3000 + US5000 — each detected and shown individually (SOC, voltage, current, power, state, SOH, cycles, temperatures), with the combined SOC capacity-weighted across models. A selector switches between "all batteries combined" and any single battery. Plug into the master unit's Console port only. Every cell of all 16 batteries is shown. |
| Screen display customization | Choose exactly which elements the physical TFT shows, with a live preview before saving. |
| Two levels of reset | Double-press the reset button to reopen WiFi setup only (nothing else touched); use Factory reset from the dashboard for a clean slate (WiFi, MQTT, alarms, login all wiped). |
| Optional remote link & cloud history | Tick one box in Settings to publish your readings to a private, key-protected link on pylon-monitor.com — check the battery from anywhere with no VPN, tunnel, port forwarding or Home Assistant, with up to three years of history. Off by default; untick it and publishing stops immediately. |
| One-click firmware update | The Update firmware page has an Update now button: the device downloads and installs the latest version itself. A .bin can still be uploaded by hand. Settings are kept either way. |
| Built-in diagnostics | An Event log page with a boot history that survives crashes, a Raw data page with the battery console's unparsed replies, and a Network page tracking WiFi signal over time with a one-click gateway test — no serial monitor needed. |
Full, illustrated feature list: pylon-monitor.com/features
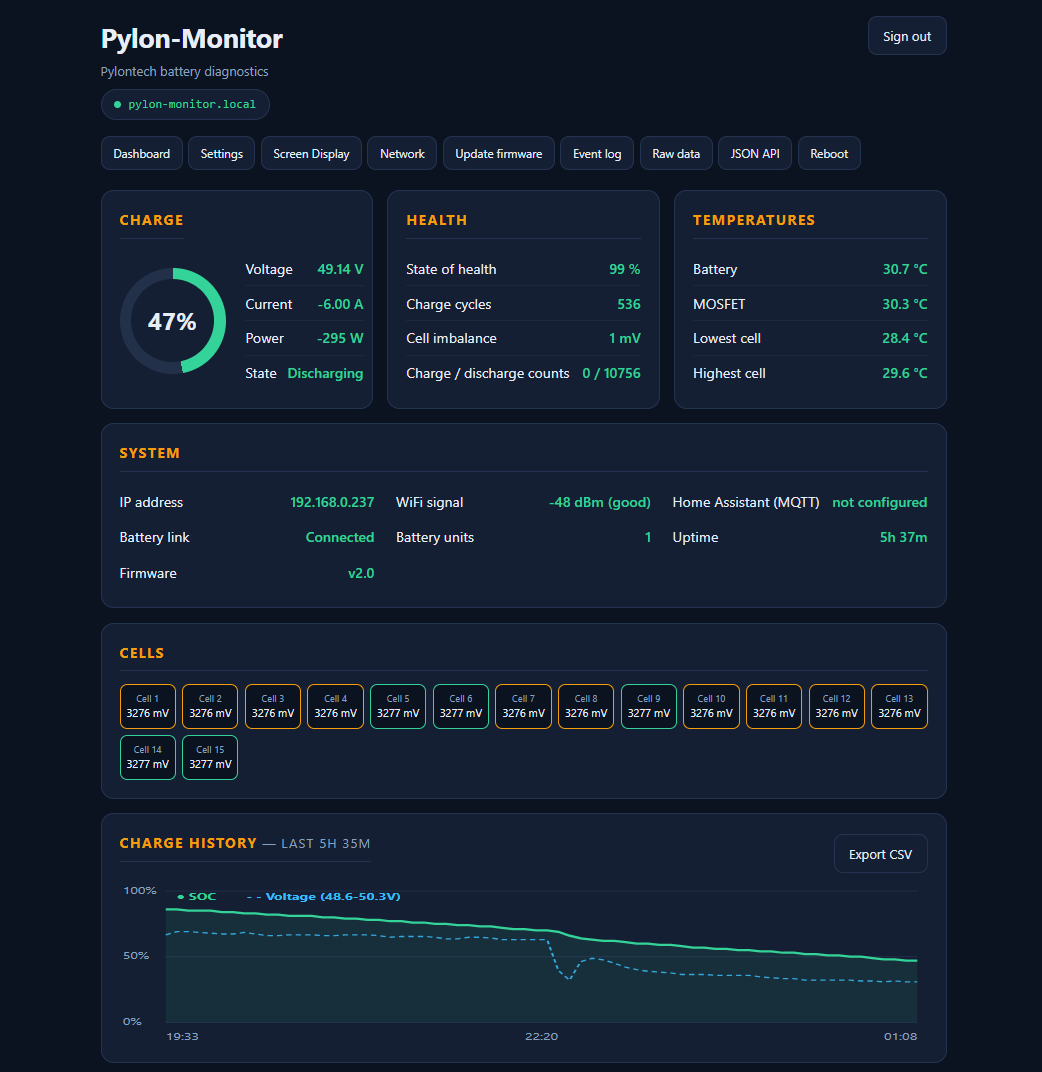
The live web dashboard — protected by your own password, refreshes every few seconds.
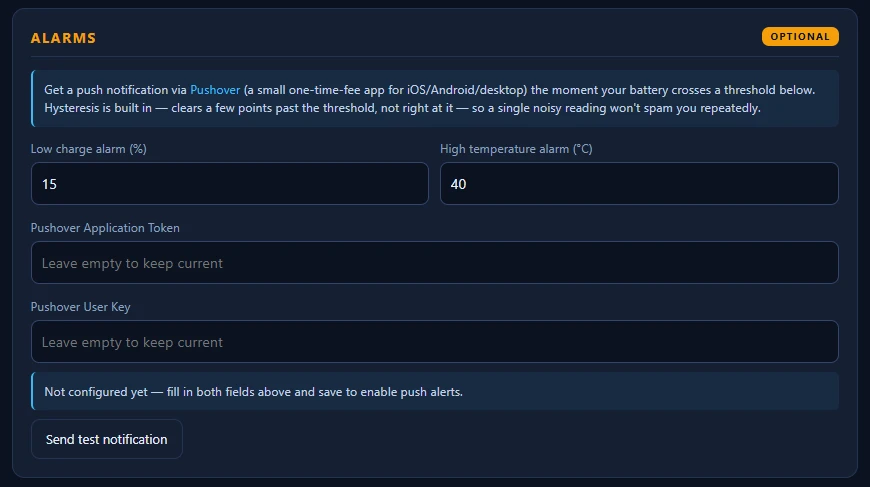
Configurable SOC/temperature alarms — set thresholds, add your Pushover credentials, test with one click.
Three models are in circulation. They share the same dashboard, JSON API, MQTT topics and Home Assistant integration — everything in this README applies to all three unless stated otherwise.
| Model | How to recognise it | Batteries read |
|---|---|---|
| Pylon-Monitor — generation 2 | With a screen, shipped from 5 September 2026 | Low-voltage US series and high-voltage Force H2 / H48050 |
| Pylon-Monitor Lite | No screen | Low-voltage US series and high-voltage Force H2 / H48050 |
| Pylon-Monitor — generation 1 | With a screen, shipped before 5 September 2026 | Low-voltage US series |
Each model has its own firmware line, and the files are not interchangeable. Picking the wrong generation breaks nothing: the device refuses the file and keeps running what it has. Every device shows its generation on its own Update firmware page, and the firmware page has one tab per model.
Pylon-Monitor works with any Pylontech battery that has a low-voltage Console / RS-232 port:
- Pylontech US5000 / US5000C (also sold as US5000-1C)
- Pylontech US3000C
- Pylontech US3000
- Pylontech US2000C
- Pylontech US2000B+
- Pylontech UP2500
- Pylontech Force-L1 family
High-voltage packs (Force H2 towers, H48050 modules behind a management unit) are read since firmware 2.8, on generation 2 and on the Lite. The device recognises a high-voltage pack from its very first reply and switches by itself — nothing to configure. Two limits, stated up front: the management unit reports no state of health and no cycle count, so those two lines show a dash instead of an invented figure; and this support was written from real console readings of two management-unit firmwares but has not yet been confirmed on a customer's high-voltage pack. Generation 1 units read the low-voltage US series only.
Not compatible with other battery brands (BYD, Dyness, Seplos, etc.) — the protocol and connector are Pylontech-specific.
Up to 16 batteries, mixed models included. A single Pylon-Monitor supports up to 16 chained batteries in total — for example 16× US5000 (≈76.8 kWh combined), 16× US2000 (≈38.4 kWh), or any mix such as 2× US2000 + 2× US3000 + 1× US5000 on the same chain. Every physical battery is queried and reported individually; the combined State of Charge is weighted by each unit's own capacity (read live from the battery, not hardcoded), so a mixed-capacity stack reports an accurate combined number instead of a naive average across units — see Under the hood below.
Pylontech's BMS console output isn't perfectly stable across firmware versions and models — the exact column layout of the pwr/bat console replies can change with a BMS firmware update, even on the same battery model. This isn't hypothetical: it's been observed on the very same US5000 model this project develops against, where a newer BMS firmware build inserts four extra diagnostic columns before the charge-state and Coulomb (SOC) fields.
A monitor that assumes a fixed column position for "State of Charge" or "charging/discharging" would, on that firmware, silently report a completely wrong number — no error, no warning, just a wrong SOC. Pylon-Monitor's firmware instead parses the real header line the battery actually sends on every poll and locates each value by name, self-adjusting to whatever layout that specific unit's BMS firmware uses. Verified against both the exact reply format used in development and a differently laid out reply reported from the field.
Two more reliability details worth knowing if you're building against this device:
- Capacity-weighted combined SOC. On a pack mixing battery models/capacities (e.g. US2000 + US3000 + US5000), the combined charge percentage is weighted by each unit's own nominal capacity — read live from the battery's own
inforeply, not hardcoded per model — rather than a plain average, which would under-represent the larger units. - Streamed diagnostics, not buffered. The
/rawdiagnostic view (exact, unparsed console replies) is streamed to the browser piece by piece rather than assembled in RAM first — building a multi-kilobyte page in one buffer before sending it is a real failure mode under memory pressure on constrained embedded hardware, especially as the number of chained batteries grows. Streaming keeps that page's memory footprint constant regardless of chain length.
None of this only matters for /api.json accuracy on a small test rig — it's specifically why the same firmware behaves correctly whether you have 1 battery or a full 16-unit chain, and whether every unit is the same model or not.
Pylon-Monitor is designed so that anyone can set it up in under two minutes, with no app, no account and no command line:
- Connect the supplied Console cable between the Pylon-Monitor device and your Pylontech battery's Console (RS-232) port.
- Power the device — the TFT screen lights up and the device boots into WiFi setup mode.
- Join the temporary WiFi network it broadcasts (
PylonMonitor-Setup) from your phone or laptop. - Pick your home WiFi network and enter its password in the captive portal that opens automatically.
- Done. The device reboots onto your network, the TFT shows its new IP address, and the dashboard is live at
http://<device-ip>orhttp://pylon-monitor.local. The first time, it asks you to create your own password (there is no default password).
Pylon-Monitor Lite (no screen): the steps are the same. To find the device after step 5, open
http://pylon-monitor.localor look for it in your router's list of connected devices.
No firmware flashing, no drivers, no third-party app required for this step. Condensed guide: pylon-monitor.com/quickstart — full step-by-step + troubleshooting: pylon-monitor.com/installation.
The core of every integration is one endpoint:
GET http://<device-ip>/api.json?key=<access-key>
- No authentication required on the local network — it's designed to be polled by home-automation platforms and scripts.
- No cloud round-trip — the response comes straight from the device, which read it straight from the battery's Console port.
- Returns the full battery state as structured JSON: charge summary, health, per-cell voltages, per-battery breakdown (for chained systems), temperatures, WiFi signal, MQTT connection status, and more.
Illustrative excerpt (see examples/api-response-example.json and the confirmed field paths used throughout the official integration docs):
{
  "summary": {
    "soc": 87,
    "voltage": 52.3,
    "current": -4.1,
    "power": -214,
    "state": "discharging"
  },
  "health": {
    "soh": 98
  },
  "net": {
    "rssi": -52
  }
}
Any tool that can do an HTTP GET and parse JSON can use this — a cron job with curl + jq, a Python/Node script, Grafana via the JSON API data source, or any home-automation platform. See the full response and every field on the device's own dashboard, or the annotated screenshots at pylon-monitor.com/tour.
Pylon-Monitor is built for Home Assistant Pylontech integration out of the box — both methods are baked into the firmware itself: no HACS, no custom component, no add-on to install on the Home Assistant side.
If you already run the Mosquitto / MQTT broker add-on in Home Assistant: enter its IP, port, username and password in the device's Settings page. The device then publishes standard Home Assistant discovery configs, and 10 sensors appear automatically under Settings → Devices & Services → MQTT, grouped under one device card named Pylon-Monitor:
| Sensor | Discovery topic |
|---|---|
| Battery SOC | homeassistant/sensor/pylon-monitor/soc/config |
| Battery SOH | homeassistant/sensor/pylon-monitor/soh/config |
| Battery voltage | homeassistant/sensor/pylon-monitor/voltage/config |
| Battery current | homeassistant/sensor/pylon-monitor/current/config |
| Battery power | homeassistant/sensor/pylon-monitor/power/config |
| Battery temperature | homeassistant/sensor/pylon-monitor/temp/config |
| MOSFET temperature | homeassistant/sensor/pylon-monitor/mostemp/config |
| Charge cycles | homeassistant/sensor/pylon-monitor/cycles/config |
| Battery state | homeassistant/sensor/pylon-monitor/state/config |
| Cell imbalance | homeassistant/sensor/pylon-monitor/celldelta/config |
All ten sensors share one state topic (pylon-monitor/state, hostname-prefixed) and the device publishes a retained availability topic (pylon-monitor/status → online / offline) with a proper Last-Will-and-Testament, so every sensor greys out correctly in Home Assistant if the device loses power or WiFi instead of silently freezing on its last value.
Home Assistant's built-in rest platform polls /api.json directly every 30 seconds and creates 6 sensors. The YAML is generated for you (with your device's current IP pre-filled) on the device's own Settings page — see examples/home-assistant-rest-sensor.yaml for the generic form.

Pasted straight into configuration.yaml — the exact block from the Settings page, no edits needed.

One of the resulting sensors (Pylontech SOC) added to a Gauge card — live at 50% here.
Don't mix option 1 and option 2 for the same sensor — you'll get duplicate entities. MQTT already covers everything REST does, and more (10 sensors vs. 6), so there's rarely a reason to use both.
Full walkthrough with screenshots: pylon-monitor.com/home-assistant
Pylontech Jeedom monitoring in three steps:
- Install the JSON plugin from the Jeedom plugin store.
- Point an equipment at
http://<device-ip>/api.json?key=<access-key>. - Map JSON paths to Jeedom commands — e.g.
summary>soc,summary>voltage,summary>state,net>rssi.
See examples/jeedom-json-plugin.md for a worked example.
Use an http request node — method GET, URL http://<device-ip>/api.json?key=<access-key>, return type a parsed JSON object — then read msg.payload.summary.soc (or any other field) downstream. If MQTT is configured on the device, you can also subscribe directly to pylon-monitor/state with an MQTT-in node — no polling required. See examples/node-red-http-request.md.
Because the data is plain, unauthenticated JSON over local HTTP, any platform that can poll a URL and parse JSON can integrate Pylon-Monitor — Domoticz's Dummy/Virtual sensors with a script, openHAB's HTTP binding, a Grafana JSON datasource panel, a Python script with requests, a shell one-liner with curl | jq, and so on. There is no vendor SDK to install and no API key to request.
- Local by default. Out of the box the device talks only to your local network and to the battery: no account, no telemetry, no subscription. Setup, dashboard, API and MQTT all work without internet access.
- Cloud is opt-in. The remote link and cloud history are one checkbox in Settings, off by default. When switched on, readings go to a private link protected by your own access key; switch it off and publishing stops immediately. Nothing else depends on it.
- Console port is read-only. Pylon-Monitor only reads battery telemetry — it never sends control or charging commands, so it does not affect the Pylontech manufacturer's warranty and cannot alter battery behaviour. It is a monitoring and diagnostics tool, not a battery management system (BMS) or charge controller.
- Password always required. You create it on first access — there is no default password — as required by European cybersecurity rules for connected devices (RED directive, EN 18031). Tools reading
/api.jsonuse the access key from Settings → Public JSON access. Forgot it? Press the reset button 3 times (generation 2 and Lite: unplugging the USB cable 3 times works too) to return to factory settings. - Updates only when you ask. The device never updates itself behind your back: it contacts the update server only when you click Update now, or installs a
.binyou upload yourself.
Pylon-Monitor receives free lifetime firmware updates, installed from the device's own dashboard — no cables, no flashing tools, settings kept.
- One click: Update firmware → Update now, and the device downloads and installs the latest version for its generation.
- By hand: download the
.binfor your model from pylon-monitor.com/firmware — one tab per model — and upload it on the same page. - Recovery: if a device is unreachable or no longer starts, the USB recovery flasher reinstalls it from the browser over USB and detects the hardware generation by itself.
Current versions (26 September 2026):
| Model | Firmware | What's new |
|---|---|---|
| Generation 2 (with screen) | v3.4.2 | Wakes up batteries whose console stays silent after a power cut (1200 baud mode). Reconnects the WiFi by itself when it drops for good. Password required (EN 18031), created by you on first access; REST tools need the access key; cloud data sent over HTTPS with a verified certificate. |
| Lite (no screen) | Lite v1.1.2 | The same changes as v3.4.2. |
| Generation 1 (with screen) | v3.1.2 | Password required (EN 18031), created by you on first access; REST tools need the access key. Same memory-light base as v3.0. |
Full changelog and downloads: pylon-monitor.com/firmware.
Is Pylon-Monitor made or endorsed by Pylontech? No. Pylon-Monitor is an independent, third-party monitoring accessory. "Pylontech" refers to the battery manufacturer; Pylon-Monitor is unaffiliated.
Does it void my Pylontech warranty? No — the Console port is used strictly read-only for monitoring, so it does not affect the battery manufacturer's warranty.
Can it control or charge my battery? No. Pylon-Monitor is a monitoring and diagnostics tool only. It never sends control or charging commands — think of it as a very capable read-only meter, not a BMS.
Does it need the cloud or an app? No. Setup, the dashboard and the API are all 100% local. No account, no app, no subscription.
Which languages does the official site support? English, French, German, Dutch, Spanish and Italian — see Available languages.
Does it work with high-voltage Pylontech (Force H2, H48050)? Yes, since firmware 2.8, on generation 2 units (shipped from 5 September 2026) and on the Lite. State of health and cycle count show a dash, because the management unit does not report them. Generation 1 units read the low-voltage US series only.
Which firmware file do I need? One per model: generation 2 (with screen, shipped from 5 September 2026), generation 1 (with screen, shipped before that date) or Lite (no screen). Your device shows its generation on its own Update firmware page, and the firmware page has one tab per model.
More questions answered at pylon-monitor.com/faq.
This repository is the public documentation, SEO/discovery hub and integration reference for the Pylon-Monitor device — installation summaries, JSON/MQTT/Home Assistant/Jeedom/Node-RED integration notes, and links to the official site.
It intentionally does not include the device firmware source code, the internal board/microcontroller design, schematics, or any other proprietary hardware/firmware detail. If you're looking for those, they aren't published here or anywhere else — only the documented, stable, public interfaces (/api.json, MQTT topics, the web dashboard) are covered, which is everything an integration needs.
The official site and this repository are fully available in:
| Language | Site | Repo README |
|---|---|---|
| 🇬🇧 English | pylon-monitor.com | README.md |
| 🇫🇷 Français | pylon-monitor.com/fr | README.fr.md |
| 🇩🇪 Deutsch | pylon-monitor.com/de | README.de.md |
| 🇪🇸 Español | pylon-monitor.com/es | README.es.md |
| 🇮🇹 Italiano | pylon-monitor.com/it | README.it.md |
| 🇳🇱 Nederlands | pylon-monitor.com/nl | README.nl.md |
- Homepage — product overview, pricing, purchase
- Features — full feature list
- Visual tour — real screenshots of every screen, including the JSON API response
- Quick start — condensed 5-step setup
- Installation guide — full setup & troubleshooting
- Home Assistant integration — detailed MQTT/REST setup, topic reference, payload examples
- Firmware — changelog & update instructions
- Customer Questions — real questions from owners, answered by the team (compatibility, setup, high voltage, ideas & roadmap)
- USB recovery flasher — reinstall a device over USB from the browser
- Pylon-Monitor vs PylonCheck — point-by-point comparison
- FAQ
- Contact
The text and examples in this repository are released under CC BY 4.0 — reuse, adapt and share freely with attribution. "Pylon-Monitor" and "Pylontech" are trademarks of their respective owners; this repository is an independent documentation resource and is not affiliated with or endorsed by Pylontech.